Marine Survey Technology
Applications of Multibeam Echosounders: From Single Soundings to Full 3D Seafloor Maps
A single-beam echosounder gives you one depth reading directly beneath the hull — a single dot on a very large map. A multibeam echosounder (MBES) asks a more ambitious question: what if every ping could paint an entire strip of the seafloor at once? That shift, from isolated soundings to continuous, full-coverage bathymetry, is what turned hydrographic surveying from a sparse sampling exercise into something closer to photographing the seabed in three dimensions.
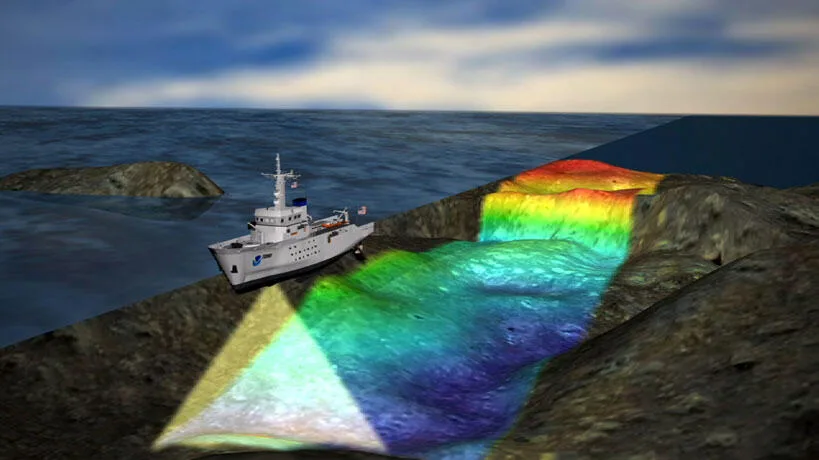
How Multibeam Echosounders Work
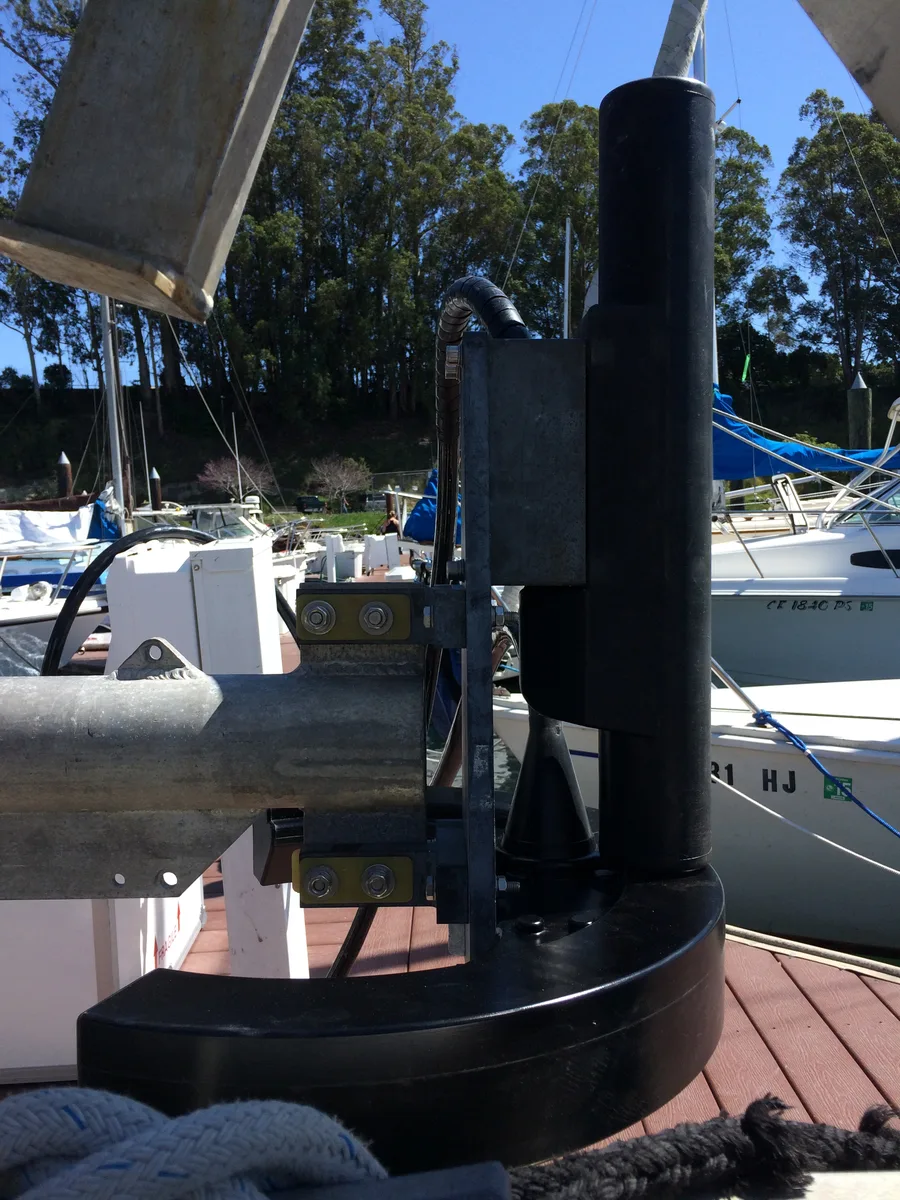
Instead of a single vertical pulse, an MBES transducer array emits an acoustic pulse shaped into a wide fan across the ship's track. On reception, digital signal processing — beamforming — steers that same returning wavefront into anywhere from dozens to over a hundred narrow beams, each roughly a degree wide across-track, so a single ping can yield hundreds of individual depth measurements distributed across a swath rather than one point directly under the hull.
Swath width scales with water depth, though the multiplier varies by system and seabed conditions — some modern shallow-water systems reach roughly 5.5 times water depth. As with sub-bottom profilers, frequency choice is a trade-off: high-frequency systems (100 kHz to 1 MHz) serve shallow water down to about a meter with sharper resolution, while low-frequency systems (10–70 kHz) are needed to reach depths beyond 10,000 meters, at the cost of coarser detail.
From the Sonar Array Sounding System to Modern Digital Beamforming
Multibeam technology traces back to the U.S. Navy's Sonar Array Sounding System (SASS), developed with General Instrument in the early 1960s to help chart the seafloor for submarine navigation. The prototype was tested aboard the USS Compass Island in 1963; the finished array — 61 beams, each one degree wide, covering a swath about 1.15 times water depth at 12 kHz — was subsequently installed aboard the survey ships USNS Bowditch, USNS Dutton, and USNS Michelson.
The technology did not reach commercial hands until 1977, when the first Sea Beam system entered service aboard the Australian survey vessel HMAS Cook, producing up to 16 beams across a 45-degree arc. A second Sea Beam unit, purchased in 1976, was installed and trialed aboard the French research vessel Jean Charcot that same spring — the results of which were published as one of the earliest peer-reviewed evaluations of commercial multibeam performance. Digital beamforming matured through the following decades: Atlas Electronik's Hydrosweep DS, installed aboard the RV Meteor in 1989, extended coverage to 59 beams across a 90-degree swath, and by the 1990s the SeaBeam 2100 could dynamically steer up to 151 beams from piezoelectric line arrays.
Core Applications in the Field
Nautical charting and safety of navigation
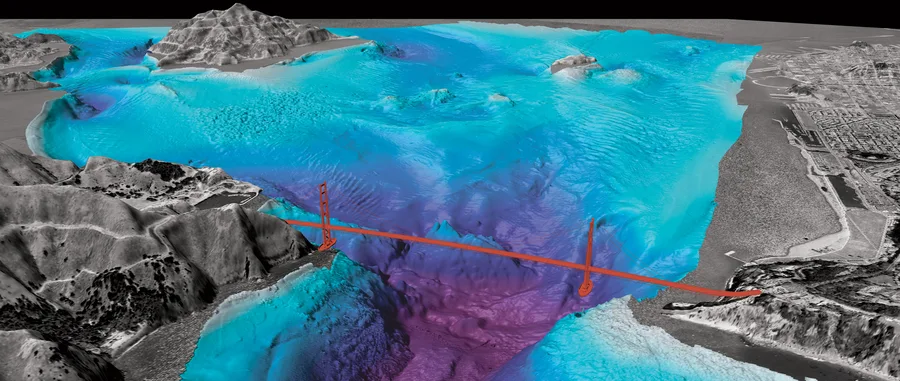
Full-coverage bathymetry is the foundation of modern nautical charts, letting hydrographic offices confirm the least depth over a shoal, wreck, or reef rather than inferring it from scattered line soundings. This remains the application that IHO survey-order standards were originally written to serve, and it is still the benchmark against which every other MBES use case is measured for accuracy.
Dredging planning and monitoring
Because MBES delivers dense, repeatable bathymetric coverage, it is the standard tool for planning dredge cuts and verifying that a channel or berth has actually reached its design depth afterward. Comparing pre- and post-dredge multibeam surfaces gives a direct volumetric measure of material removed, which is difficult to obtain reliably from single-beam lines alone.
Offshore energy site investigation and cable routing
Offshore wind and subsea cable projects depend on detailed seafloor morphology to route cables around obstacles, assess scour potential, and site turbine foundations. Multibeam bathymetry is routinely combined with sediment profile imagery and other geophysical data during route surveys and site characterization studies to build a complete picture of seabed conditions before installation begins.
Port and harbor maintenance
Ports and harbor authorities run repeat multibeam surveys of berths, basins, and approach channels to track sediment accumulation, confirm underkeel clearance, and support regulatory compliance — work that benefits directly from the tightened, near-total coverage requirements introduced for critical areas in the latest hydrographic survey standards.
Seafloor habitat mapping and marine research
Beyond depth alone, MBES backscatter and derived terrain products are used to classify seafloor sediment type and structure, supporting benthic habitat mapping. The USGS, for instance, combined multibeam echosounder data with towed-camera video observations offshore south-central California to characterize benthic habitat for the Bureau of Ocean Energy Management's Cal DIG I alternative-energy project — work that folds bathymetric survey data directly into environmental planning.
Turning Soundings Into a Trusted Surface: Calibration and Processing
Raw multibeam data is only as good as the corrections applied to it. Before a system is trusted for production surveying, it must undergo a patch test in an area of known bathymetry, resolving four installation offsets in a fixed order — time delay, pitch, roll, and heading — so that beams from a moving, rolling vessel line up correctly across overlapping swaths. Sound velocity through the water column, typically measured with expendable bathythermograph (XBT) casts, must also be applied during processing, since an uncorrected sound-speed error bends every beam's calculated position outward or inward from where it actually struck the seabed.
Once corrected, the resulting point cloud — often hundreds of soundings per square meter — is too dense to hand-edit sounding by sounding. Modern workflows commonly rely on the CUBE algorithm (Combined Uncertainty and Bathymetry Estimator), which statistically combines overlapping soundings into a single depth surface along with an uncertainty estimate at every node, letting surveyors flag and inspect only the areas where the data disagrees with itself.
Standards: IHO S-44 and the Push for Full Coverage
The International Hydrographic Organization's S-44 standard, first published in 1968, defines the accuracy and coverage a survey must meet depending on its intended use — from Order 2 surveys in deep, low-risk areas to Special Order and the newly introduced Exclusive Order for critical zones such as berths and channels with minimal underkeel clearance, where required accuracy tightens to roughly ±10 cm. The latest edition also raised bathymetric coverage requirements substantially for the higher-order categories, moving Order 1a and Special Order toward full, 100% seafloor ensonification rather than the sparser partial coverage older editions allowed — a shift that only became practical because dense-swath multibeam systems made total coverage achievable in reasonable survey time. A new Specification Matrix in the same edition was added specifically to accommodate emerging techniques, including satellite-derived bathymetry, alongside conventional MBES data.
Case in Point: Seabed 2030
The clearest demonstration of how far multibeam technology has scaled is Seabed 2030, a joint initiative of the Nippon Foundation and GEBCO launched in 2017 to compile a complete map of the world's ocean floor into the freely available GEBCO Ocean Map. At the IHO Assembly in Monaco on April 20, 2026, the project reported that 28.7% of the global seafloor — roughly 104 million km², an area equivalent to more than two-thirds of Earth's land surface — had been mapped to modern standards, with nearly 5 million km² added in the preceding year alone from 220 contributing organizations. Multibeam survey data from national hydrographic offices, including Brazil's Navy Directorate of Hydrography and Navigation and Japan's JAMSTEC, made up a substantial share of that new coverage, alongside satellite-derived bathymetry contributed by initiatives such as the Greenwater Foundation.
Conclusion
From 61 fixed beams tested aboard a single Navy ship in 1963 to a globally coordinated effort mapping millions of square kilometers a year, the multibeam echosounder has become the default instrument whenever a project needs to know not just how deep the water is, but what the entire seafloor beneath it actually looks like. Side-scan sonar tells you what's sitting on the bottom, and a sub-bottom profiler reveals what's buried beneath it — MBES answers the question that both of those techniques ultimately depend on: exactly where that seafloor is.
References
- Wikipedia — Multibeam echosounder
- Unique Group — Understanding Multibeam Echosounders and Their Applications
- Discovery of Sound in the Sea (DOSITS) — Multibeam Echosounder
- International Hydrographic Review — Sea Beam, Multi-Beam Echo-Sounding in "Jean Charcot" — Description, Evaluation and First Results
- International Hydrographic Organization — IHO Releases New Standards for Hydrographic Surveys (S-44 Edition 6)
- NOAA Ocean Exploration — Multibeam Calibration: Conducting a Patch Test
- USGS — NOAA Multibeam Mapping Diagram; Multibeam Echosounder System; Multibeam Bathymetry of San Francisco Bay
- USGS — Multibeam Echosounder, Video Observation, and Derived Benthic Habitat Data Offshore South-Central California (Cal DIG I / BOEM)
- Seabed 2030 — Global Seabed Mapping Reaches New Milestone as Five Million Square Kilometres Added in a Year