Geofisika & Geohazard
Benthic Habitat Mapping: Turning Backscatter and Ground-Truth Into a Seafloor Ecosystem Map
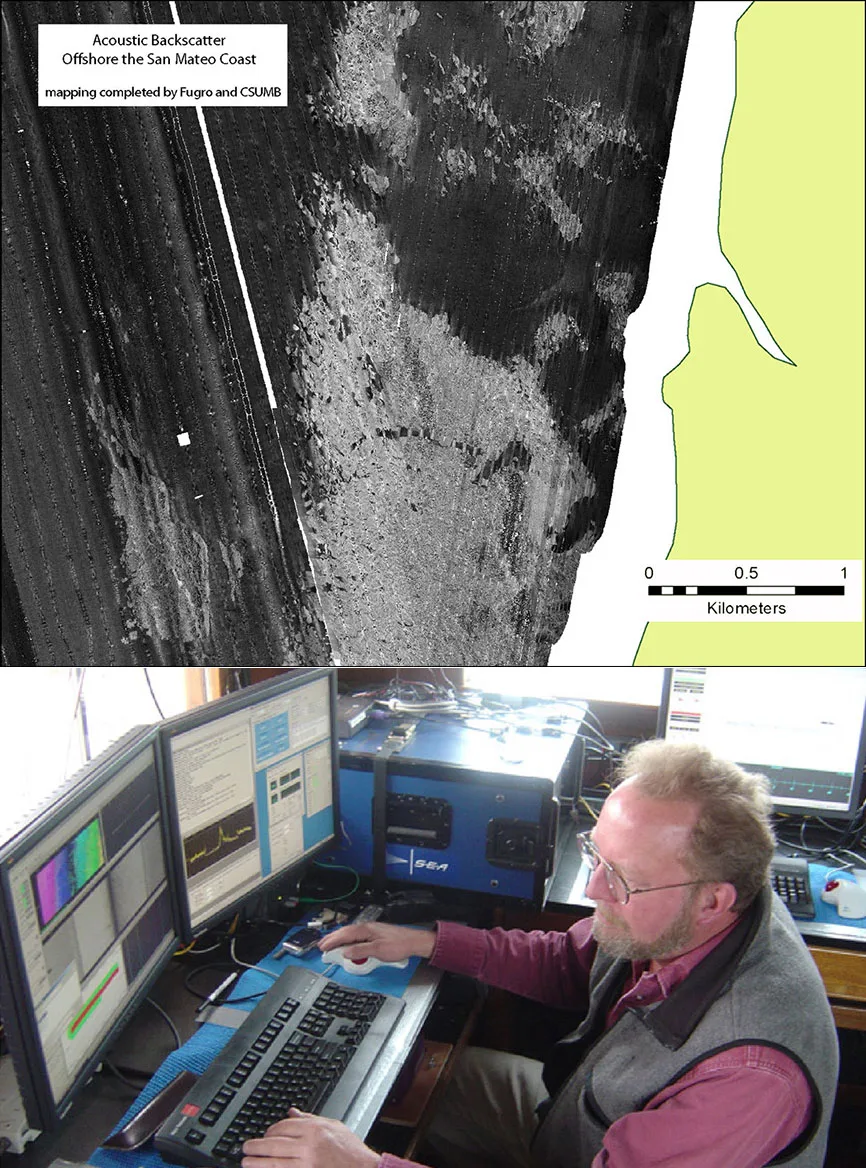
The same backscatter data already covered on this site for engineering purposes — classifying seabed sediment for foundation design, dredging, and cable routing — answers a completely different question when a marine ecologist asks it instead of an engineer. Where an engineer wants to know whether the seabed is sand or clay, an ecologist wants to know whether it's the kind of seabed a particular species can live on. Benthic habitat mapping is what happens when that acoustic sediment data gets pointed at conservation and environmental permitting instead of construction.
Why Multibeam Leads the Toolkit
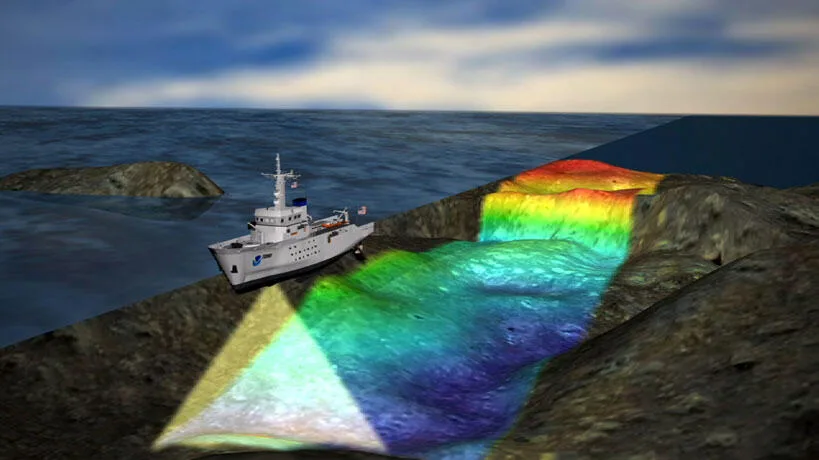
Multibeam echosounders (MBES) have become the preferred instrument for habitat mapping work because a single pass collects full-coverage bathymetry and backscatter simultaneously, with the system correcting for vessel motion and signal attenuation as it goes. Multibeam backscatter provides as much or more seabed detail than side-scan sonar alone, and collecting bathymetry and backscatter together in one dataset — rather than running two separate instruments — is a large part of why MBES has displaced side-scan as the default tool for this kind of survey.
The Workflow: Acoustic Data Still Needs a Second Opinion
A habitat mapping survey follows a consistent sequence: acquire bathymetry and backscatter across the site, ground-truth a representative sample of the acoustic classes with drop cameras, ROV video, or physical grab samples, then run a classification process that links the acoustic signature to what was actually observed on the seabed. That classification step splits into two broad approaches — unsupervised methods that cluster the acoustic data statistically and use ground-truth data afterward to interpret what each cluster represents, and supervised methods that use ground-truth data up front to define class signatures the whole survey area is then classified against. Either way, the acoustic data alone is never the final product; it has to be tied to physical observation before it becomes a habitat map rather than just a sediment map.
Case in Point: Classifying Rhodolith Beds in Brazil
A 2024 study in the Costa das Algas Marine Protected Area, on the continental shelf of Espírito Santo in southeastern Brazil, mapped rhodolith beds — biogenic habitat built from unattached, coral-like nodules of calcareous red algae — across depths of 43 to 200 metres using a multispectral approach. The survey ran an R2Sonic 2024 multibeam system across three acoustic frequencies (170, 280, and 400 kHz) with a 90-degree angular sector and 256 beams, producing backscatter mosaics at 0.5-metre resolution that were later aggregated to 5 metres for statistical modelling. Ground-truthing came from 33 underwater sampling stations using drop-camera images of 60-by-60-centimetre seabed quadrats, with rhodolith coverage in each image measured by manual delineation in ImageJ.
The classification itself used a support vector machine with a radial basis kernel, validated by leave-one-out cross-validation, sorting the seabed into four rhodolith coverage classes: none, less than 15 percent, 15 to 35 percent, and greater than 35 percent. The multispectral model distinguishing simple presence or absence of rhodolith achieved 0.84 accuracy; the finer four-class coverage model reached 0.71 — a meaningful drop in accuracy that illustrates a general pattern in acoustic habitat classification: the more ecologically detailed the question, the harder it becomes to answer from acoustic signature alone, and the more the result depends on the density and quality of the ground-truth data backing it up.
Why This Feeds Directly Into Permitting
Benthic habitat maps built this way feed environmental impact assessment and marine protected area management in a direct, practical sense: once a survey has classified which parts of a site carry sensitive biogenic habitat like rhodolith or coral beds versus bare sediment, that map becomes the basis for siting decisions, exclusion zones, and monitoring baselines for offshore construction, dredging, or fishing management. The underlying acoustic and ground-truth methodology is the same regardless of who's asking the question — but a habitat map built for conservation planning has to hold up to a different kind of scrutiny than a sediment map built for foundation design, because the cost of misclassifying a rhodolith bed as bare seabed isn't an engineering overrun, it's a habitat that gets damaged before anyone realises it was there.
References
- "Multispectral Multibeam Backscatter Response of Heterogeneous Rhodolith Beds," PMC/National Library of Medicine, https://pmc.ncbi.nlm.nih.gov/articles/PMC10657437/
- Hydro International, "Benthic Habitat Mapping," https://www.hydro-international.com/content/article/benthic-habitat-mapping
- "Evaluation of Supervised and Unsupervised Classification Techniques for Marine Benthic Habitat Mapping Using Multibeam Echosounder Data," ICES Journal of Marine Science, https://academic.oup.com/icesjms/article/72/5/1498/761886
- "Integrating Multibeam Backscatter Angular Response, Mosaic and Bathymetry Data for Benthic Habitat Mapping," PLOS ONE, https://journals.plos.org/plosone/article?id=10.1371%2Fjournal.pone.0097339
- "Benthic Habitat Mapping: A Review of Progress Towards Improved Understanding of the Spatial Ecology of the Seafloor Using Acoustic Techniques," ScienceDirect, https://www.sciencedirect.com/science/article/abs/pii/S0272771411000485
Related Articles