Hidrografi
Dredging Survey and Volume Calculation
Dredging contracts are rarely paid by the day or by the hour — they are paid by the cubic meter of material actually removed. That single fact turns a bathymetric survey from a nice-to-have into the document that determines how much money changes hands. Get the "before" and "after" seabed models wrong, even slightly, and the volume calculated between them can be wrong by a margin that matters to everyone signing the invoice.
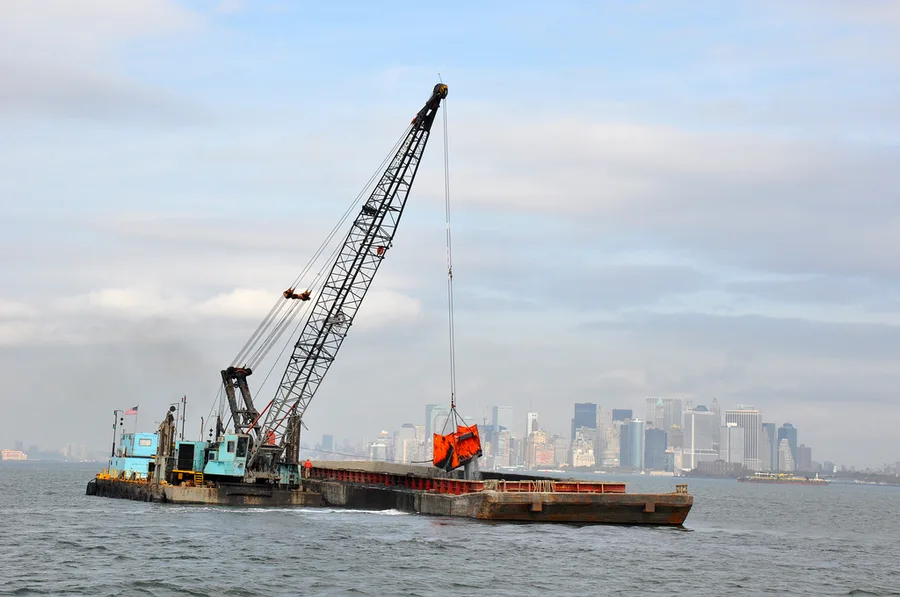
In the United States alone, the Army Corps of Engineers dredges more than 200 million cubic yards of material every year just to keep roughly 25,000 miles of federal navigation channels usable. Every cubic yard of that figure traces back to the same basic idea: survey the bottom before work starts, survey it again after, and calculate the difference. The idea is simple. Getting the number right, consistently, across contractors, software, and seabed conditions, is not.
Two Surveys, One Number
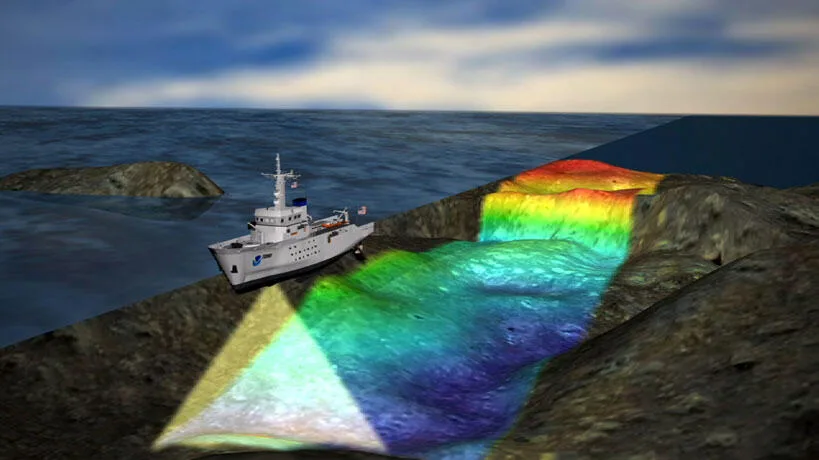
A dredging volume calculation always starts with a pair of bathymetric surveys covering the same footprint: one taken before the dredge begins work (the pre-dredge or "as found" survey), and one taken after (the post-dredge or "as dredged" survey). Both are typically collected with a multibeam echosounder sweeping the full width of the channel or berth, producing a dense grid of depth points rather than isolated soundings. The two surveys are then compared, point by point, to work out how much material sat between the old seabed and the new one.
That comparison sounds like simple subtraction, but the two datasets rarely line up as neatly as a single number would suggest. Survey vessels don't retrace the exact same track twice, water levels differ between the two survey days, and the raw soundings from each survey have to be turned into a continuous surface before they can be compared at all. That surface-building step is where the two dominant volume-calculation methods diverge.
Cross-Section Method vs. Grid Method
Cross-section method
The cross-section approach slices the survey area into a series of parallel vertical planes, spaced at regular intervals along the channel or berth. At each slice, the surveyor measures the cut area — the cross-sectional area of material lying between the pre-dredge and post-dredge seabed profiles. Multiplying each area by the horizontal distance to the next section, then summing across every slice, gives the total volume. This is often called the average end area method, and it has been the standard approach in channel and canal earthworks for well over a century, long before digital bathymetry existed, because it maps naturally onto how a channel is designed in the first place: as a series of design cross-sections.
Grid (TIN) method
The grid method takes a different route to the same answer. Instead of slicing the area into cross-sections, it builds a continuous surface model, typically a Triangulated Irregular Network (TIN), from each survey's raw soundings, then calculates the volume of the space between the two surfaces directly, cell by cell or triangle by triangle, across the entire footprint at once. Because it isn't tied to a fixed line spacing, the grid method tends to capture irregular seabed features, uneven dredging, and localized shoaling more faithfully than a handful of widely spaced cross-sections can.
Why the Same Seabed Can Produce Different Numbers
Three practical issues make dredging volume calculation harder than "survey twice, subtract" implies.
Overdepth allowance
Contracts rarely specify a single target depth with zero tolerance. The U.S. Army Corps of Engineers, for example, routinely specifies a required dredging depth plus an allowable overdepth — commonly a foot or two beyond the design depth — within which the contractor is still paid, because no dredge can hit an exact depth across an entire channel with perfect precision. Material removed below that allowance, deeper than even the overdepth permits, typically isn't paid for at all. That means the survey has to distinguish material within the paid prism from material outside it, not just measure a single total volume.
Soft mud and the "nautical depth" problem
In many ports, the seabed doesn't end cleanly at a hard bottom — it transitions gradually through a layer of fluid mud, sediment dense enough to show up on an echosounder but soft enough that a ship's hull can pass through it safely. PIANC's concept of nautical depth defines the practical seabed not as a fixed elevation but as the level where the mud's density or shear strength reaches a critical threshold, commonly around 1,200 kg/m³, beyond which contact starts to affect a vessel's manoeuvrability. A 2021 hydrographic case study at Berth 301 of the Santa Catarina Terminal in Brazil illustrates the effect directly: using a dual-frequency echosounder alongside a mud-density probe, surveyors found a navigable fluid-mud layer 0.5 to 1.2 metres thick along the berth, thick enough that where the "seabed" is deemed to sit — and therefore how much material is deemed to have been dredged — depends heavily on which density threshold the survey adopts, not just on where the echosounder's ping bounces back.
Consolidation between cycles
Freshly disturbed sediment doesn't stay put. Between one maintenance dredging cycle and the next, loosened material settles and consolidates, changing density and, in some cases, partially refilling the dredged prism before the next survey ever takes place. A channel dredged to design depth today can show measurable shoaling within months, not because the earlier survey was wrong, but because the seabed itself kept moving after the survey crew left. This is a central reason maintenance dredging is a recurring line item in port budgets rather than a one-time cost, and why the interval between the "after" survey of one cycle and the "before" survey of the next matters as much as the surveys themselves.
Turning a Survey Into an Invoice
None of this is abstract for the people signing off on a dredging contract. USACE guidance is explicit that hydrographic survey drawings and estimated quantities in a solicitation should be produced as close to the advertisement date as possible, commonly within 120 days, precisely because a stale survey misrepresents how much material is actually there by the time work begins. Once dredging is complete, the same logic applies in reverse: the post-dredge survey has to be timely, methodologically consistent with the pre-dredge survey, and clear about which volume-calculation method was used, because switching methods between the two surveys of the same project can introduce a discrepancy that has nothing to do with the actual dredging performed.
That is ultimately what separates a dredging volume calculation from an academic exercise in surface modelling: it is a number two parties rely on to settle a payment, and the survey methodology behind it — which sensor, which threshold, which interpolation method, which allowance — has to be documented and agreed on before the dredge ever starts moving material, not reconstructed afterward from whichever dataset happens to be convenient.
The Survey Is the Contract's Ruler
A dredging volume is never a raw measurement; it's a calculation built from two surveys, a chosen interpolation method, and a set of contractual thresholds for overdepth, nautical bottom, and payment prisms. Understanding that is the difference between treating a bathymetric survey as paperwork and treating it as what it actually is: the instrument that both the client and the dredging contractor are trusting to settle how much work was done, and how much it's worth.
References
- Eye4Software, "Volume Calculation using Cross-Sections," Hydromagic Hydrographic Survey Software Documentation, https://www.eye4software.com/hydromagic/documentation/manual/post-processing/volume-calculation-sections/
- "Dredging Volume Analysis Using Different Software," IOP Conference Series: Earth and Environmental Science, Vol. 1127 (2023), https://www.researchgate.net/publication/367324047_Dredging_Volume_Analysis_Using_Different_Software
- "Dredge Volume Calculation Using Grid Volume Model at Sharm Obhur, Red Sea — A Case Study," ResearchGate, https://www.researchgate.net/publication/331739511_Dredge_Volume_Calculation_Using_Grid_Volume_Model_at_Sharm_Obhur_Red_Sea-A_Case_Study
- "Single Beam Bathymetric Data Modelling Techniques for Accurate Maintenance Dredging," ScienceDirect / NRIAG Journal of Astronomy and Geophysics, https://www.sciencedirect.com/science/article/pii/S1110982314000106
- International Hydrographic Review (IHR), "Nautical Depth Investigation in Fluid Mud Environment at Santa Catarina Terminal (Port of São Francisco do Sul, Brazil)," https://ihr.iho.int/articles/nautical-depth-investigation-in-fluid-mud-environment-at-santa-catarina-terminal-port-of-sao-francisco-do-sul-brazil/
- U.S. Army Corps of Engineers, ER 1130-2-520, "Overdepth Dredging and Payment," https://www.spn.usace.army.mil/Portals/68/docs/Dredging/guidance/overdepth.pdf
- U.S. Army Corps of Engineers, EM 1110-2-1003, "Hydrographic Surveying," https://www.publications.usace.army.mil/Portals/76/Publications/EngineerManuals/EM_1110-2-1003.pdf
- Defense Media Network, "Army Corps of Engineers Dredging," https://www.defensemedianetwork.com/stories/army-corps-of-engineers-dredging/
Related Articles