Hidrografi
Port and Channel Hydrographic Survey
A survey vessel working twenty miles offshore can tolerate a sounding that is off by half a metre; the chart will still keep a ship safe. Bring that same vessel into a harbour approach channel, and half a metre stops being a rounding error — it can be the difference between a container ship clearing the bottom and one sitting on it. Port and channel surveys are not a smaller, easier version of open-water hydrography. They are a distinct discipline, built around a much narrower margin for error.
The reason is simple physics dressed up as logistics. In open water, a ship has depth to spare beneath its hull in almost every direction. In a harbour entrance or a dredged channel, that clearance — the gap between the ship's keel and the seabed, known as under-keel clearance or UKC — can shrink to a fraction of the vessel's draft. Get the seabed depth wrong by even a modest margin, and you have quietly erased the ship's safety buffer without anyone on the bridge knowing it happened. That single fact reshapes everything about how these surveys are planned, executed, and verified.
Why Ports and Channels Sit in Their Own Category
The International Hydrographic Organization addresses this directly in its S-44 Standards for Hydrographic Surveys, which sorts every survey into an "order" based on how critical the area is to safe navigation. The logic is straightforward: the less room a ship has to spare, and the more hazardous the seabed itself, the stricter the survey has to be. Ports, harbour approaches, and navigation channels sit at the sharp end of that scale — not because they are technically harder to reach, but because the consequences of missing something are so much more immediate.
Special Order — where the seabed itself is the hazard
Special Order applies where under-keel clearance is critical and the seabed character is dangerous in its own right — rock, boulders, wrecks, anything that could hole a hull rather than just ground it gently in mud. This order demands "100% bottom search": survey lines run dense enough, backed by side-scan sonar or a multibeam array, that no patch of seafloor goes unchecked. The numbers behind it are exacting — horizontal accuracy of 2 metres, a vertical (depth) uncertainty budget of a = 0.25 m and b = 0.0075 in the standard formula TVU = ±√(a² + (b·d)²), and a requirement to detect any feature larger than 1 metre.
Order 1 — the working standard for harbours and channels
Order 1 (the current S-44 terminology; some derivative documents such as NOAA's Hydrographic Surveys Specifications and Deliverables still use the older label "Order 1a," a naming difference between editions that is worth flagging rather than glossing over) covers harbours and general intercoastal and inland navigation channels where clearance is somewhat more forgiving or the bottom is softer sediment rather than rock. Its tolerances relax accordingly: horizontal accuracy of 5 metres plus 5% of depth, a vertical uncertainty budget of a = 0.5 m and b = 0.013, and feature detection down to 2 metres in water shallower than 40 metres, loosening to 10% of depth beyond that. NOAA's own specification defines this tier for harbours, harbour approach channels, recommended tracks, inland navigation channels, and coastal areas with heavy commercial traffic — almost always waters shallower than 100 metres.
Order 2, Order 3, and the newer Exclusive Order
Order 2 covers depths under 200 metres that don't meet Order 1 or Special Order criteria, with horizontal accuracy of 20 metres plus 5% of depth and a looser uncertainty budget (a = 1.0 m, b = 0.023). Order 3 applies beyond 200 metres, using the same a/b values as Order 2 but with horizontal accuracy relaxed to 150 metres plus 5% of depth — appropriate for water where no ship is going to graze the bottom regardless of small sounding errors. At the opposite extreme sits Exclusive Order, added in a recent S-44 edition specifically for the most sensitive berthing areas: 200% feature search and 200% bathymetric coverage, meaning every point on the seabed is swept at least twice by overlapping swaths, with depth accuracy tightened to roughly ±10 centimetres. Where 100% coverage is required, NOAA specifies side-scan sonar run alongside multibeam as the primary tool, with a 50-metre search radius used to actively disprove the presence of hazardous features on every pass.
Key Point: In open water, there is plenty of room for error; in a port or narrow channel, a few centimetres' discrepancy between the charted depth and the real one can be the difference between a ship passing safely and running aground — which is exactly why IHO S-44 mandates Special Order and even Exclusive Order accuracy (depth precision to ±10 cm, seabed coverage up to 200%) specifically for these areas.
Line Spacing and the Shift Toward Full Coverage
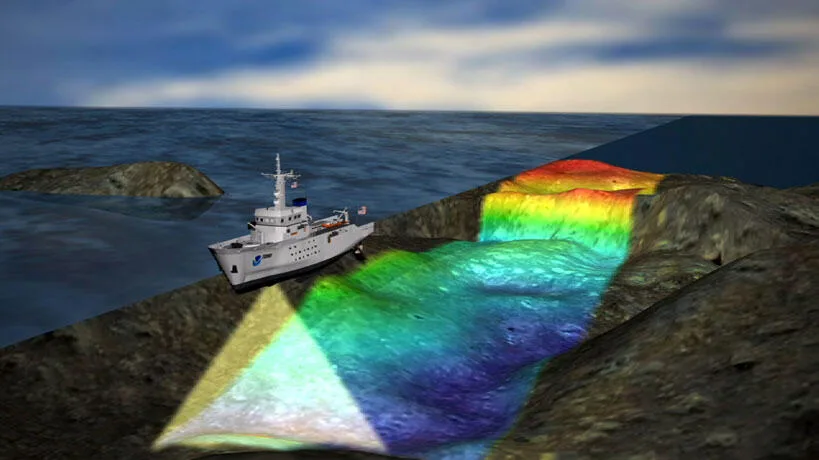
Away from ports, hydrographic survey design is largely a question of line spacing — how far apart to run parallel survey tracks so that adjacent swaths overlap enough to avoid data gaps. A typical overlap of 10-25% of the effective swath width is enough for most open-water work. As the area gets more critical, that overlap climbs, and in the most sensitive zones it can reach 100% or more, meaning every part of the seabed gets swept by more than one pass.
Push far enough up that scale, though, and the whole framing changes. For Special Order and Exclusive Order work, the governing concept stops being "line spacing" measured in metres and becomes "bathymetric coverage" measured as a percentage — 100% or 200% of the seabed guaranteed swept, rather than a distance between tracks. It is a subtle but important distinction: the question is no longer how close together the lines are, but whether any patch of seafloor, anywhere, has been missed entirely.
That distinction matters most in the parts of a port that don't cooperate with a tidy survey plan. Turning basins — the circular pools where large vessels rotate to reverse direction — along with wideners and other irregularly shaped areas often can't be fully covered by the straight, parallel lines that work well in a rectangular channel. Survey teams have to adapt the line pattern to the actual geometry of the area, a departure from the standard grid that is generally understood as a necessary exception in survey design rather than a shortcut, though the precise rules governing exactly how much deviation is acceptable are better confirmed against the current S-44 text itself than assumed from general practice.
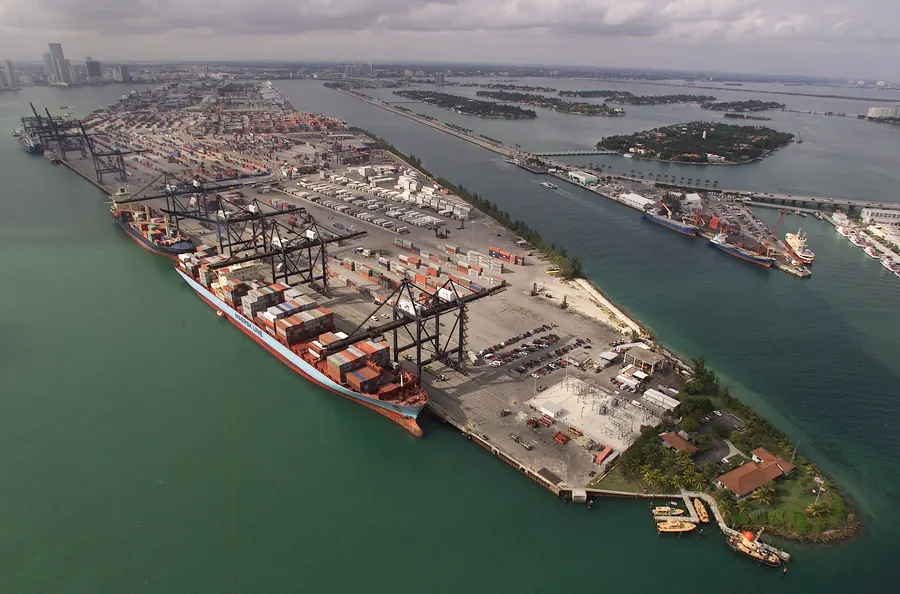
Under-Keel Clearance: The Real Problem Being Solved
All of that accuracy exists to answer one operational question: how much water does a ship actually have beneath its keel? Under-keel clearance is calculated, in its simplest form, as the charted depth minus the ship's draft, adjusted for the tide at that moment. PIANC — the World Association for Waterborne Transport Infrastructure — recommends a net UKC of at least 0.5 metres, rising to 1.0 metre in channels with hard or rocky bottoms, where the consequences of touching the seabed are far more severe than a soft grounding in mud. PIANC's 2014 guidelines also define a "manoeuvring margin" — the average clearance maintained beneath a moving vessel over time — recommending a minimum of 5% of the ship's draft or 0.6 metres, whichever is larger, as adequate for most vessel types and channel conditions.
Net UKC is not a single fixed number; it is squeezed by three separate categories of variability. Water-level factors include the astronomical tide, meteorological effects from pressure and wind, wave action, and even Ekman transport, which in certain regions can depress sea level by as much as 60 centimetres in a single day. Vessel factors cover the ship's static draft, changes in water density (which can add 2-3% of buoyancy loss moving from salt to fresh water), the squat effect, and dynamic heel from wind or yaw. Seabed factors bring the survey itself directly into the equation — bathymetric uncertainty, sedimentation building up between dredging cycles, and tolerances in how precisely a dredge actually achieves its design depth.
Squat deserves particular attention because it is counterintuitive. As a ship's speed increases, the pressure field around its hull changes in a way that pulls the vessel down and can tilt it along its transverse axis — the faster the ship, the shallower the water, the larger the effect. In a narrow channel where speed and depth are both constrained, squat is not a minor correction; it is one of the more consequential variables in the whole UKC calculation, and getting it modelled accurately matters as much as getting the sounding accurate in the first place.
This is worth sitting with for a moment: the accuracy demanded by Special Order and Exclusive Order surveys is not a bureaucratic checkbox. Bathymetric uncertainty from the survey itself is one of the three inputs that directly determines how much safety margin a ship actually has when it transits a channel. A sloppier survey doesn't just produce a less precise chart — it eats directly into the physical clearance available to every vessel that uses that channel afterward. The economic upside cuts the other way too: a mere 10-centimetre increase in permissible draft can add meaningfully to cargo capacity on an ore carrier or container ship, without a single dollar spent on additional dredging — a direct financial return on getting the survey and UKC management right.
The modern extension of this thinking is IHO's S-129, a standard for under-keel clearance management systems built on the newer S-100 data framework. S-129 pulls together real-time tidal data (S-104), surface currents (S-111), electronic navigational charts (S-101), and bathymetric surfaces (S-102) into a single engine that calculates dynamic UKC for route planning and near-real-time voyage monitoring. In the United States, the regulatory link back to the ship's bridge is explicit: 33 CFR 157.450 requires masters to calculate UKC based on their deepest navigational draft and discuss it with the harbour pilot before approaching US waters.
Working Around Traffic That Never Stops
Ports rarely close for a survey crew. Ships keep arriving, tugs keep working, and the survey vessel has to operate inside that traffic rather than around it — which brings a different set of rules into play. A survey vessel towing equipment underwater, such as a side-scan sonar towfish, has genuinely limited ability to manoeuvre and is required under COLREGs Rule 27 to display the day shapes and lights for a vessel "restricted in her ability to manoeuvre": two balls or diamonds connected vertically by day, three all-round lights (red-white-red, stacked) at night, plus additional shapes indicating which side carries the obstruction and which side is clear for other traffic to pass. Under COLREGs Rule 35, the same vessel must sound one prolonged blast followed by two short blasts at intervals of no more than two minutes — a signal that becomes especially important in restricted visibility within a busy, narrow channel.
Vessel Traffic Service (VTS) is the other half of that coordination. The IMO recommends VTS particularly in areas with high traffic density, hazardous cargo, difficult navigation, narrow channels, or environmental sensitivity — precisely the conditions a port survey operates in. VTS draws on AIS position data, surveillance sensors, and other sources, and it distributes meteorological and hydrographic information back out to vessels in the area, giving the survey team and commercial traffic a shared operational picture rather than two separate ones.
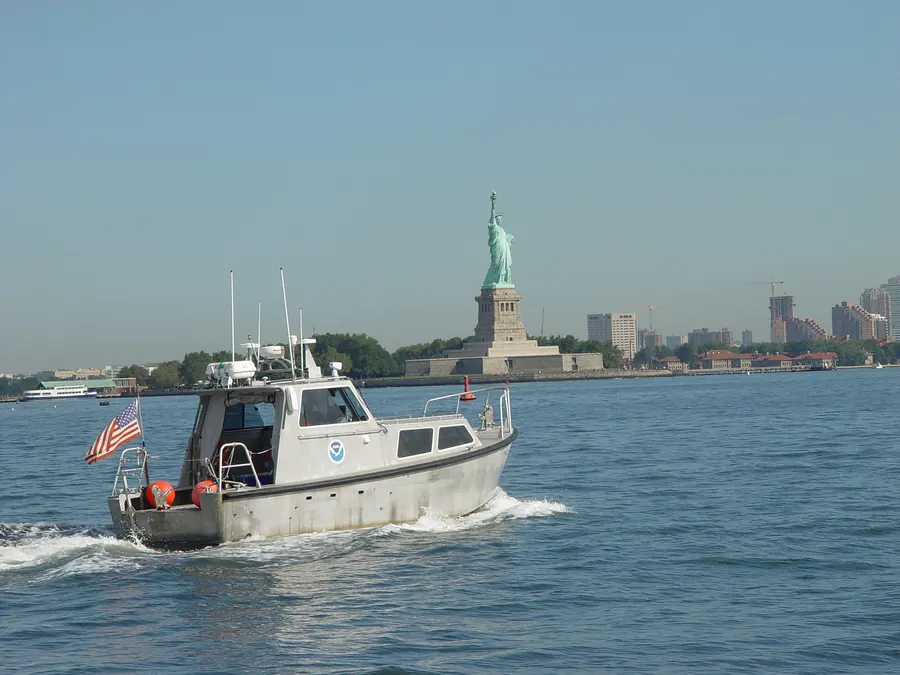
NOAA's practice illustrates how this plays out on the ground: regional navigation managers work directly with port authorities, pilot associations, mariners, and state agencies to schedule survey activity inside ports that never stop operating. The clearest example of this coordination under pressure came after Hurricane Sandy in 2012, when NOAA survey vessels — including the ship Thomas Jefferson and its survey launches — checked channels, canals, and terminals throughout the Port of New York and New Jersey for navigation hazards before commercial shipping traffic was allowed to fully resume. That work had to happen inside an economically sensitive, still-operating port, coordinated closely with port authorities and the Coast Guard, precisely the kind of high-stakes scheduling problem that doesn't exist in open-water survey work.
Three Projects Where This All Comes Together
The standards, the line-spacing logic, and the traffic coordination described above are not abstractions — they show up together in real dredging and channel-improvement projects around the world.
Dar es Salaam, Tanzania
A feasibility study and detailed design project for the Port of Dar es Salaam covered deepening a 5-kilometre entrance channel to -16.50 metres and a further 3-kilometre inner channel to -15.50 metres, along with construction of a turning basin, all aimed at safely accommodating Post-Panamax container ships. A project of that scale depends entirely on survey data accurate and dense enough to confirm the new channel geometry will deliver the clearance those larger vessels require.
Houston Ship Channel, Texas
The Houston Ship Channel Expansion Channel Improvement Project, known as "Project 11," included widening the Barbours Cut Channel and enlarging the diameter of the turning basin at its junction with the main channel. This is a direct real-world example of the turning-basin challenge described earlier: redesigning an irregularly shaped manoeuvring area requires detailed bathymetric survey work to confirm the new geometry is genuinely safe for large vessels rotating through it, not just adequate on paper.
Mobile Ship Channel, Alabama
A modernisation programme for the Mobile Ship Channel deepened the Bar, Bay, and River Channel segments by five feet each, toward a project depth of 50 feet. Work of this kind depends on before-and-after survey comparison to confirm the design depth has actually been achieved along a channel that remained in active commercial use throughout construction — a routine but essential discipline in channel maintenance dredging.
A Different Standard, Not a Smaller One
It is tempting to think of port and channel survey as open-water hydrography scaled down — the same instruments, just pointed at a smaller, shallower area. That framing misses what actually distinguishes the work. The accuracy demands, the shift from line spacing to full bathymetric coverage, the direct link to a ship's under-keel clearance budget, and the need to operate safely inside continuous vessel traffic are not adjustments to the open-water playbook. They are a separate discipline, built around a single fact: in a narrow channel, the seabed itself is part of the ship's safety margin, and the survey is the only thing standing between an assumed depth and the real one.
References
- IHO (International Hydrographic Organization), "S-44 Standards for Hydrographic Surveys, Edition 6.1.0", https://iho.int/uploads/user/pubs/standards/s-44/S-44_Edition_6.1.0.pdf
- International Hydrographic Review (IHR), "International hydrographic survey standards", https://ihr.iho.int/articles/international-hydrographic-survey-standards/
- Catarino, G.R. (2021), "Dynamic Draft and Under Keel Clearance: A Hydrographic View", International Hydrographic Review, Vol. 26, November 2021, https://ihr.iho.int/articles/dynamic-draft-and-under-keel-clearance-a-hydrographic-view/
- PIANC, Report No. 121-2014, "Harbour Approach Channels – Design Guidelines", https://www.pianc.org/publication/harbour-approach-channels-design-guidelines/
- NOAA Office of Coast Survey, "Hydrographic Surveys Specifications and Deliverables", https://nauticalcharts.noaa.gov/publications/docs/standards-and-requirements/specs/HSSD_2023-2-02.pdf
- IMO (International Maritime Organization), "Vessel Traffic Services", https://www.imo.org/en/ourwork/safety/pages/vesseltrafficservices.aspx
- IHO, "S-129 Under Keel Clearance Management (UKCM)" product page, http://s100.iho.int/product%20specification/division-search/s-129-under-keel-clearance-management-ukcm
- NOAA Office of Coast Survey, "Navigation Response", https://nauticalcharts.noaa.gov/customer-service/navigation-response.html
- Wikipedia, "Under keel clearance", https://en.wikipedia.org/wiki/Under_keel_clearance
- Western Dredging Association (WEDA), "Project 11: Segments 1 and 2 – Widening the Houston Ship Channel", https://www.westerndredging.org/phocadownload/2022_Houston/Proceedings/4A-2.pdf
- Technital S.p.A., "Feasibility study and detailed design of the dredging of Dar es Salaam port entrance channel and turning basin (Tanzania)", https://www.technital.net/projects/marine-and-coastal/dredging-and-land-reclamation/ingenieria-maritima-y-costera-feasibility-study-and-detailed-design-of-the-dredging-of-dar-es-salam-port-entrance-channel-and-turning-basin-tanzania
- Dredging Today, "Improving Port of Mobile ship channel", https://www.dredgingtoday.com/2021/05/26/improving-port-of-mobile-ship-channel/
- MDPI (Suszka, S. et al.), "Method of Time Estimation for the Bathymetric Surveys Conducted with a Multi-Beam Echosounder System", Applied Sciences 13(18):10139, 2023, https://www.mdpi.com/2076-3417/13/18/10139
Related Articles