Marine Survey Fundamentals
Vertical Datum and Tidal Correction in Hydrographic Survey
A depth marked on a nautical chart means nothing without knowing what it's measured from. Sea level itself rises and falls by meters over a single day because of tides, so an echosounder reading taken at high tide and the same spot sounded again six hours later at low tide would report two very different numbers for what's supposed to be the same, fixed seafloor. Hydrographic survey solves that not by picking one convenient reading and hoping for the best, but by referencing every depth to a carefully defined vertical datum, and by predicting or measuring the tide precisely enough to strip its effect out of the data entirely.
Why Depth Needs a Reference Point
A chart datum is the water surface a chart's printed depths and predicted tide heights are both measured from — a fixed reference plane, not a real, physical water level anyone could point to on any given day. Common choices include Mean Lower Low Water in the United States and, across most of the rest of the world, Lowest Astronomical Tide (LAT): the lowest level the tide is predicted to reach under average meteorological conditions across any combination of astronomical circumstances. In seas with negligible tidal range, such as the Baltic, mean sea level is used instead since there's no meaningful tidal cycle to reference against. The International Hydrographic Organization and International Maritime Organization first suggested in the early 1980s that charting authorities consider adopting an astronomical level as chart datum, and in 1993 the Tidal Working Group formally recommended LAT specifically for North Sea charts; agencies including the UK Hydrographic Office and the Australian Hydrographic Service subsequently adopted it more broadly. LAT's main practical advantage is straightforward: because it's defined as the lowest predictable tide level, a charted depth referenced to it is always a conservative, non-negative number — a vessel is never going to encounter less water than the chart implies from tidal state alone.
Predicting the Tide Before Computers Existed
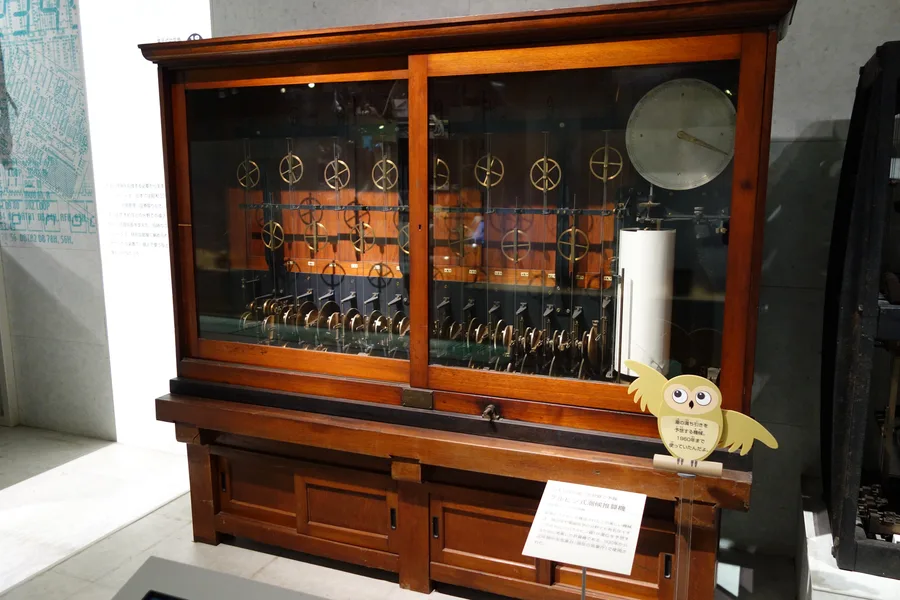
Tides are the sum of many separate periodic motions — the Moon's orbit, the Sun's apparent motion, and various longer astronomical cycles — each contributing its own regular oscillation to the total water level at a given place. The breakthrough that made tide prediction mathematically tractable came in the 1860s, when William Thomson (later Lord Kelvin) applied Fourier analysis to decompose the tide into these individual harmonic constituents, each with its own known period. Thomson built the first tide-predicting machine in 1872 to turn that theory into a usable tool: ten separate mechanical components, each geared to the exact period of one tidal constituent and fitted with its own adjustable amplitude, were linked together so that a single hand-cranked rotation summed all ten oscillations at once, with an ink pen tracing the resulting combined curve onto a moving roll of paper. What would have taken enormous manual effort to calculate could be cranked out for an entire year of predictions in about four hours. George Darwin extended Thomson's work using the lunar theory of his own era, introducing the naming convention for tidal constituents — M for lunar, S for solar, K for lunisolar — that hydrographers still use today. Decades later, Arthur Doodson brought that harmonic framework up to date using a more accurate lunar theory, distinguishing 388 separate tidal frequencies, each expressible as a combination of six fundamental astronomical frequencies now known as Doodson numbers.
Old Brass Brains: Half a Century of American Tide Prediction
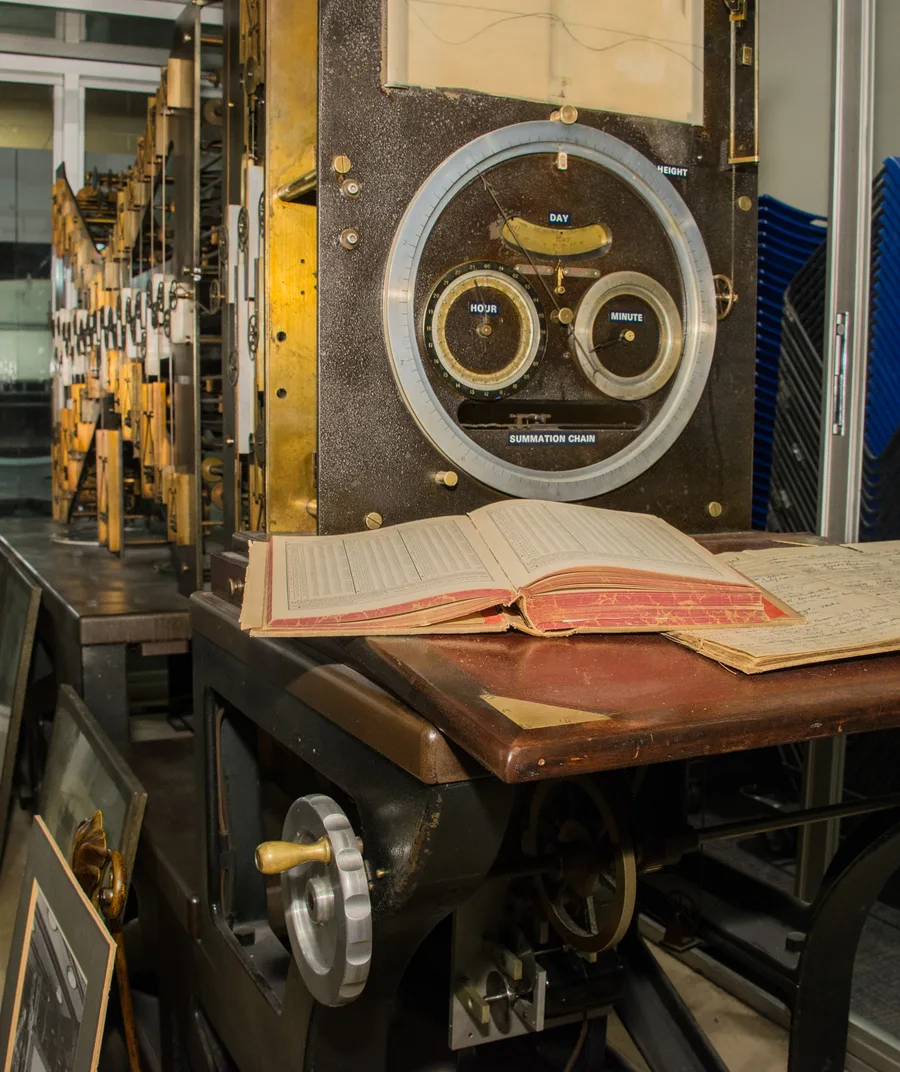
The U.S. Coast and Geodetic Survey ran its own tide-predicting machine, Tide Predicting Machine No. 2, in daily service from 1910 until 1965 — a 10.8-foot-long, roughly 2,500-pound assembly of gears, pulleys, and chains that operators nicknamed "Old Brass Brains." Turned by hand crank, it mechanically summed dozens of harmonic constituents to produce official U.S. tide predictions for more than half a century, only retiring once electronic computers could do the same calculation faster and without the physical machine's maintenance burden. Its British counterpart, the Doodson-Légé machine built in 1948–49 to Arthur Doodson's specifications, played the equivalent role for the United Kingdom, resolving up to 42 tidal constituents and remaining in daily use into the early 1960s.
Measuring the Tide Directly: Tide Gauges Then and Now
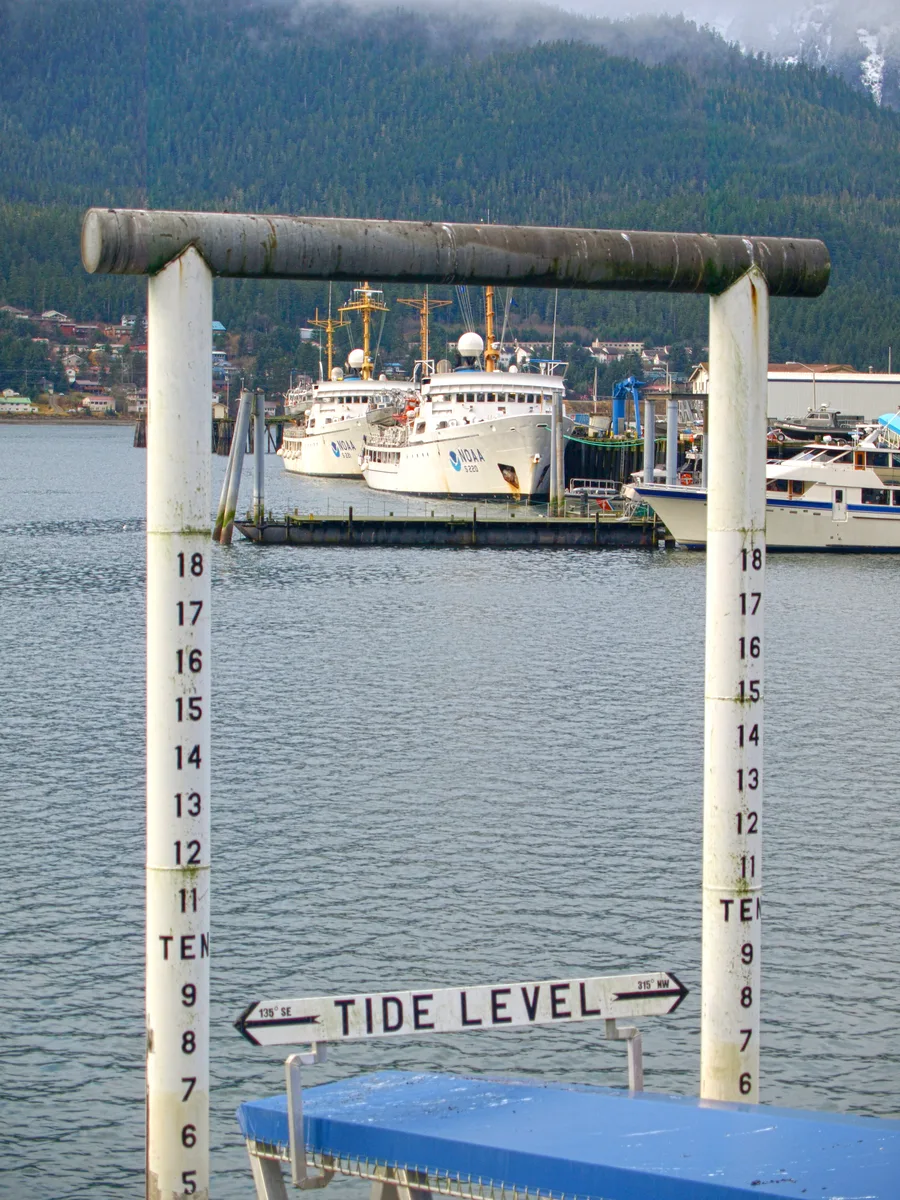
Prediction is only half the job — a survey also needs to know what the tide actually did at the time soundings were taken, which is where tide gauges come in. The earliest gauges were simple staff gauges: a graduated board read manually at intervals, often set inside a stilling well, a length of pipe open at the bottom that damps out wave action so the water level inside settles closer to the true tidal level rather than jumping with every passing swell. Self-recording versions added a float connected to a pen tracing a continuous line on a rotating drum, removing the need for someone to read and log the staff by hand around the clock. Modern tide gauges have largely replaced the mechanical float with electronic sensing: pressure sensors submerged below the water surface, acoustic sensors that time a sound pulse's round trip through a sounding tube, and radar sensors that measure the same round-trip timing using a microwave pulse instead of sound — all producing a continuous digital water-level record without a moving float or drum.
The Shift Toward GNSS: Ellipsoidally Referenced Surveying
A newer approach sidesteps some of the tide gauge network's practical limitations entirely. Ellipsoidally referenced surveying (ERS) positions the survey vessel — and therefore every depth it records — within a three-dimensional GNSS coordinate frame tied to the geodetic ellipsoid, then applies a separation model that translates that ellipsoidal height directly into the chart datum, rather than relying on a nearby tide gauge and co-tidal correction zones to do the same job. GNSS water-level buoys can establish chart datum offshore in places no fixed tide gauge could practically be installed, and initiatives such as Canada's Continuous Vertical Datum for Canadian Waters project have built spatially continuous ellipsoid-to-chart-datum separation surfaces specifically to support this technique — an approach already touched on from the positioning side in Sonarfix's article on sound velocity in bathymetry, where PPP-corrected GNSS buoys are used to derive continuous, centimeter-precision water-level data. ERS doesn't eliminate tide gauges from hydrography, but it does reduce how much a survey has to depend on one being nearby and well-calibrated.
Standards: Water Level Inside IHO S-44
The IHO S-44 standard's Total Vertical Uncertainty budget — the maximum allowable depth error a survey can carry at a 95% confidence level — explicitly names water-level error as one of its contributing components, alongside range error, beam angle error, and vessel motion. A survey isn't compliant with a given S-44 order just because its echosounder is accurate and its sound velocity profile is correct; the tidal reduction applied to every sounding, whether from a nearby gauge, a predicted harmonic model, or an ellipsoidally referenced separation surface, has to meet the same accuracy bar as everything else in the measurement chain.
Conclusion
A number on a chart is only as trustworthy as the water level it was measured against, and getting that reference right has occupied hydrographers for a century and a half — from Kelvin's hand-cranked brass gears in 1872, through Old Brass Brains grinding out American tide tables until 1965, to a GNSS buoy deriving a chart datum offshore today. None of those tools changed what a chart datum actually is; they only changed how precisely, and how automatically, a sounding could be tied back to it.
References
- Wikipedia — Chart Datum; Tide-Predicting Machine; Theory of Tides
- International Hydrographic Organization, Tidal Working Group — Lowest Astronomical Tide as Chart Datum: Definition and Safety Aspects
- IEEE Spectrum — Lord Kelvin's Tide-Predicting Machine
- National Tidal and Sea Level Facility — The Doodson-Légé Tide Predicting Machine
- NOAA Office of Coast Survey — Ellipsoidally Referenced Surveys (ERS)
- International Hydrographic Organization — S-44 Standards for Hydrographic Surveys (Total Vertical Uncertainty)
- Wikimedia Commons — Kelvin's Tide Predictor, Tokyo; Tide Predicting Machine No. 2; NOAA Tide Level, Juneau
Related Articles

.jpg)
