Geofisika & Geohazard
Pockmarks and Gas Seepage: Reading the Seafloor's Own Warning Signs
A pockmark is a crater-like depression in the seafloor, formed where fluid or gas has escaped upward through the sediment. On its own, that simple shape carries two very different meanings for the same survey team: it can be a geohazard warning — a sign of unstable, gas-charged sediment that could complicate drilling, piling, or pipeline burial — or it can be a resource clue, pointing toward hydrocarbon accumulation deeper in the section. Telling which one a given pockmark actually represents is where the real interpretive work happens.
How Pockmarks and Seepage Show Up in Survey Data
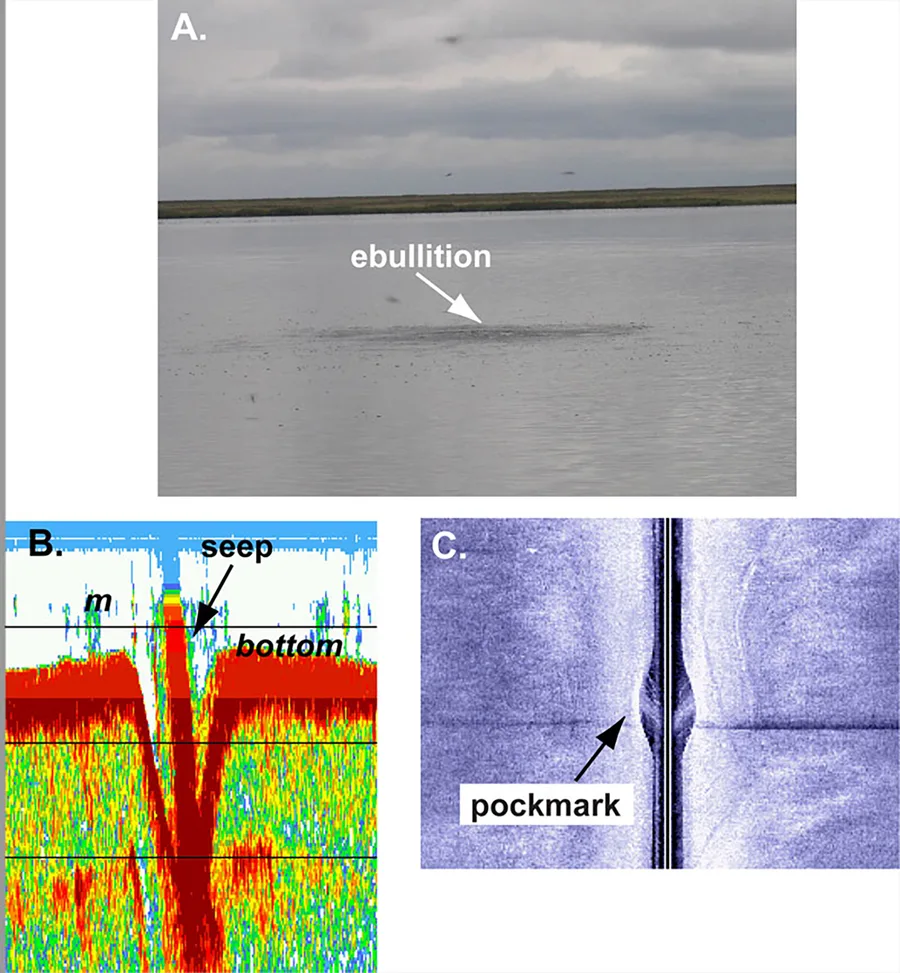
Gas moving through sediment leaves a recognisable signature across several instruments at once. On seismic reflection and sub-bottom profiler data, shallow gas produces acoustic blanking — a zone where the signal simply goes dark because gas bubbles scatter and absorb the acoustic energy — along with enhanced reflectors, seismic "chimneys" marking a vertical migration path, and bright spots: unusually high-amplitude reflections that indicate a change in what's filling the pore space, often used as a direct hydrocarbon indicator. On the seabed itself, side-scan sonar and multibeam bathymetry map the physical crater the escaping fluid leaves behind. And where gas is actively escaping right now, multibeam systems can pick up the plume itself as a flare in the water-column data, rising directly above the pockmark.
Case in Point: Mapping 4,150 Pockmarks in the Central North Sea
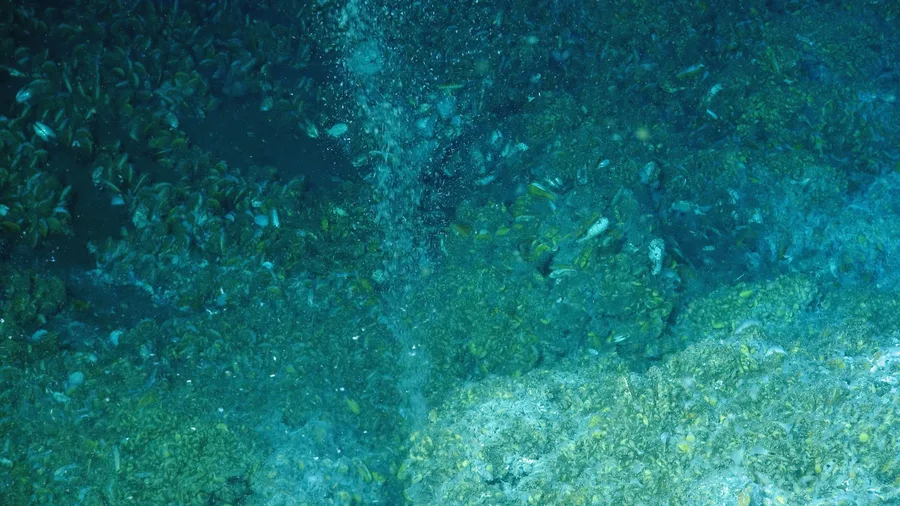
A 2012 study developed a semi-automated GIS workflow specifically to recognise, delineate, and morphometrically characterise pockmarks at scale, then applied it across 18 site surveys covering the central North Sea. The method mapped almost 4,150 pockmarks in total. The great majority were small and inactive — typically 20 to 100 metres in diameter and only 3 to 4 metres deep — but the survey also identified a smaller population of much larger, active pockmarks, up to 500 metres across and as deep as 17 metres, a scale difference that itself signals a fundamentally different type of fluid-escape event behind the two populations.
Case in Point: Dormant Craters Over an Active Field at Troll
The pockmarks overlying Norway's Troll petroleum reservoir in the North Sea make the active-versus-inactive distinction concrete. These craters reach up to about 250 metres in diameter and 10 metres deep, and were most likely formed by the decomposition of methane hydrates roughly 11,000 years ago — but a metagenomic study of the sediment found no, or very low, present-day methane seepage, and no free gas in the shallow sediment despite dissolved methane increasing below 70 metres depth. Rather than the methane-oxidising microbial communities that would be expected around an actively leaking seep, the sediment was dominated by autotrophic nitrifying organisms, particularly Nitrosopumilus, recycling CO2 partly derived from historic hydrocarbon degradation rather than metabolising fresh methane. The pockmarks at Troll sit directly above a producing petroleum reservoir, yet the geochemical and microbial evidence points to a dormant, relict feature rather than an active leak — a reminder that a pockmark's presence is a historical record as much as it is a current-state map.
Why Classification Is the Actual Deliverable
Finding a pockmark is the easy part — modern multibeam and sub-bottom data make them straightforward to spot once a survey knows what pattern to look for. The harder and more valuable task is classifying what each one means for the project at hand: an active pockmark near a planned pipeline route is a live gas hazard that has to be routed around or specifically engineered for, while a large field of ancient, dormant pockmarks like those at Troll is a historical record that can inform reservoir understanding without necessarily threatening a nearby structure today. Getting that classification wrong in either direction — treating a dormant feature as an active hazard, or missing an active one because a survey stopped at bathymetry alone — is the actual risk a pockmark survey exists to manage.
References
- Gafeira, J., Long, D., Diaz-Doce, D., "Semi-Automated Characterisation of Seabed Pockmarks in the Central North Sea," Near Surface Geophysics, https://onlinelibrary.wiley.com/doi/abs/10.3997/1873-0604.2012018
- "Metagenomic and Geochemical Characterization of Pockmarked Sediments Overlaying the Troll Petroleum Reservoir in the North Sea," PMC/National Library of Medicine, https://pmc.ncbi.nlm.nih.gov/articles/PMC3478177/
- "Surface and Subsurface Expressions of Gas Seepage to the Seabed — Examples from the Southern North Sea," ScienceDirect, https://www.sciencedirect.com/science/article/abs/pii/S0264817205000292
- "Gas Seepage, Pockmarks and Mud Volcanoes in the Near Shore of SW Taiwan," Marine Geophysical Research, https://link.springer.com/article/10.1007/s11001-010-9097-6
- U.S. Geological Survey, "Methane Seeps," https://www.usgs.gov/media/images/methane-seeps
Related Articles
Geohazards in Marine Construction: Why Survey Comes Before Engineering
Applications of Sub-Bottom Profilers: Revealing What Lies Beneath the Seafloor