Geofisika & Geohazard
Airborne Gamma-Ray Spectrometry: Mapping Coastal Sediment by What It Radiates, Not What It Reflects
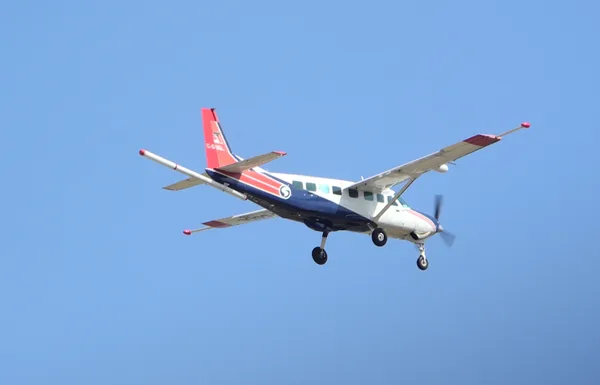
Every marine geophysical instrument covered so far in this series works by sending something out — sound from an echosounder, current from an electrode array, laser light from a lidar — and reading what comes back. Airborne gamma-ray spectrometry is built the opposite way. It sends nothing. It flies an aircraft low over the coast and simply counts the gamma rays that the ground itself is already emitting, then uses that count to map what the surface sediment is made of.
A Technique Born from Uranium, Not the Coast
The method has nothing to do with the sea in its origins. Less than a year after Robert Hofstadter developed the sodium-iodide (NaI(Tl)) scintillation detector in 1948, Canadian researchers had already mounted one in an aircraft to hunt for uranium deposits. Through the 1950s and into the mid-1960s, total-count airborne radioactivity surveys — recording gamma intensity but not distinguishing which element produced it — were flown by Australia, Canada, the Soviet Union, and the United States, largely as a Cold War-era prospecting tool. The real turning point came at the end of the 1960s, when geophysicist Quentin Bristow developed and tested a true gamma-ray spectrometer capable of separating the signal into distinct energy channels; by 1970 the instrument was ready for routine survey work. The 1973 OPEC oil embargo then gave the method a second, much larger push: Canada's Uranium Reconnaissance Program and the United States' National Uranium Resource Evaluation (NURE) program both used airborne gamma-ray spectrometry (AGRS) to blanket-survey the continent for domestic uranium, leaving behind a legacy dataset still being reprocessed with modern statistical techniques today.
What none of those Cold War planners were optimizing for was coastal sediment — but the physics that makes AGRS good at finding uranium ore turns out to be just as good at telling beach sand apart from beach sand.
Three Elements, One Instrument
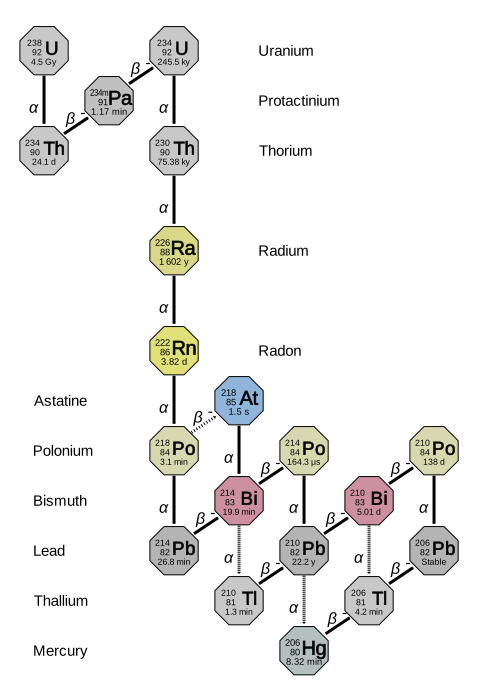
A gamma-ray spectrometer does not measure radioactivity in general; it measures three naturally occurring radioelements separately, by the distinct gamma-ray energies each one emits as it decays: potassium-40 (⁴⁰K), and the decay-series products of uranium-238 and thorium-232, conventionally reported as equivalent uranium (eU) and equivalent thorium (eTh). Because gamma rays are absorbed quickly by rock and soil, what the aircraft actually detects is a statistical estimate of K, eU, and eTh concentration in roughly the upper one metre of the surface, averaged over a horizontal footprint several hundred metres wide — a survey that is inherently shallow and inherently smoothed, which is precisely what makes it complementary to acoustic methods that profile downward instead of sideways.
Case Study: Reading Heavy-Mineral Sand from the Sky in South Carolina
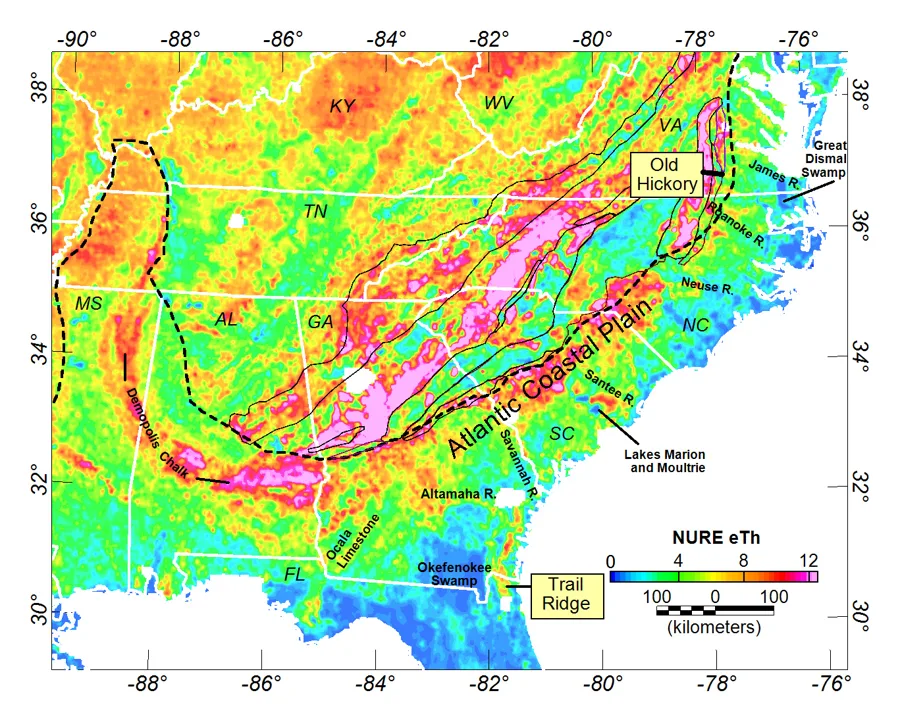
In 2019, the U.S. Geological Survey commissioned a high-resolution airborne magnetic and radiometric survey over a 134-by-90-kilometre block covering Charleston, South Carolina, flown by Terraquest Ltd. with 400-metre flight-line spacing — at the time, the first high-resolution public aeroradiometric dataset of its kind in the region. The primary motive was seismic-hazard mapping of the Charleston seismic zone, but the radiometric channel did something the magnetic data could not: because monazite in heavy-mineral sand deposits is naturally enriched in thorium, the eTh channel directly imaged the shoreline sand ridges themselves, showing anomalies concentrated over 3-to-12-kilometre-long, 400-to-1,200-metre-wide bands — geometrically similar to the deposits actively mined at the Trail Ridge and Folkston system straddling the Georgia–Florida border, one of the largest heavy-mineral sand mining districts in the United States. A 2021 synthesis published in GSA Today drew on this and companion Atlantic Coastal Plain surveys to argue that airborne radiometrics had, in effect, given geologists an unprecedented top-down view of Quaternary coastal-plain geochemistry that no amount of ground sampling could economically replicate at that scale.
When the Instrument Goes Underwater Instead of Airborne
The same spectroscopic principle also works submerged, on a towed sled instead of an aircraft — a variant developed specifically because some coastal radiometric problems are not about geology but about contamination. In the Irish Sea off the Sellafield nuclear reprocessing plant, decades of licensed low-level liquid discharge — on the order of 3×10¹⁶ becquerels of caesium-137 released by 1990 — left the seabed sediment itself measurably radioactive. A towed underwater gamma-ray spectrometer let researchers map that contamination directly across the seabed rather than relying only on discrete grab samples, producing an estimated sub-tidal sediment inventory of roughly 455 terabecquerels of ¹³⁷Cs as of 2006, with a further ~300 terabecquerels understood to have been remobilised out of the sediment near Sellafield between 1989 and 2009 as the water column concentration declined and the seabed re-equilibrated. It is the same core measurement as an airborne survey — passive gamma counting, converted into a spatial map — deployed for a monitoring problem instead of a mapping one.
From Mapping Minerals to Tracking Sediment Movement
A more recent, and for a survey company arguably more practical, application uses the same three-channel signature the other way around: not to find a deposit, but to tell where sediment came from and where it is going. Because different sediment sources carry different K/eTh/eU ratios — a kind of natural radiometric fingerprint — researchers have used eTh/eU and eTh/K cross-plots to distinguish sediment supplied by different rivers along a coastline, and to trace how sediment disturbed by dredging redistributes afterward. It is a low-cost way to get a provenance answer that would otherwise require laboratory mineralogy on a large sample set.
None of this replaces multibeam bathymetry, side-scan sonar, or sub-bottom profiling for the questions those instruments are built to answer. What airborne and towed gamma-ray spectrometry add is a channel none of them have: a direct, passive read on surface sediment composition, at a scale — tens to hundreds of square kilometres in a single flight — that no grab-sampling programme could match on the same budget.
References
- Government of Canada — 108. Airborne Gamma-ray Spectrometry (1970), History of the Geological Survey of Canada
- Geological Society of America, GSA Today (Nov. 2021) — Mapping Critical Minerals from the Sky
- U.S. Geological Survey — Airborne Magnetic and Radiometric Survey, Charleston, South Carolina and Surrounds, 2019
- U.S. Geological Survey — Critical Mineral Resources in Heavy Mineral Sands of the U.S. Atlantic Coastal Plain
- IAEA-TECDOC-1363 — Guidelines for Radioelement Mapping Using Gamma Ray Spectrometry Data
- ScienceDirect, Marine Pollution Bulletin — Measurement of Marine Radionuclide Distribution Using a Towed Sea-Bed Spectrometer
- PubMed — Artificial Radionuclides in the Irish Sea from Sellafield: Remobilisation Revisited
Related Articles
Applications of Marine Magnetometers and Gradiometers in Underwater Surveys
Ground-Penetrating Radar in the Intertidal Zone: The Instrument That Only Works Where Water Doesn't Stay Salty