Hidrografi
Turbidity in Coastal Survey: The Practical Number That Decides Whether Lidar Will Even Work
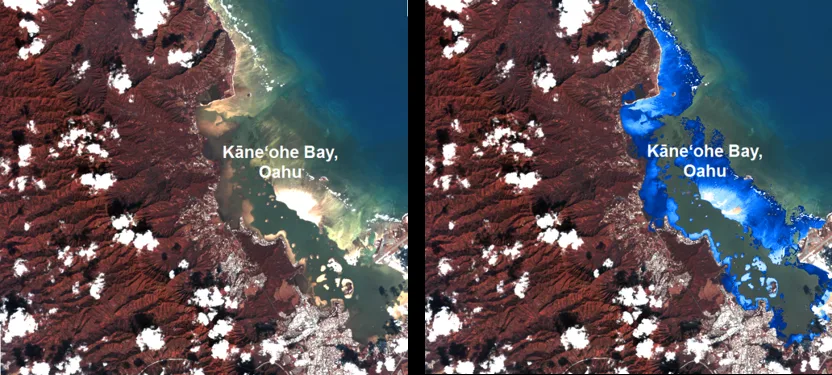
Satellite-derived bathymetry and airborne lidar, both covered elsewhere on this site, depend entirely on light making it down to the seabed and back — and turbidity is the single water quality parameter that decides how far that light actually gets. Measuring it correctly, and knowing what the number means for a planned survey, is a small piece of fieldwork that determines whether an expensive optical survey mission succeeds or comes back with unusable data.
What a Turbidity Reading Actually Measures
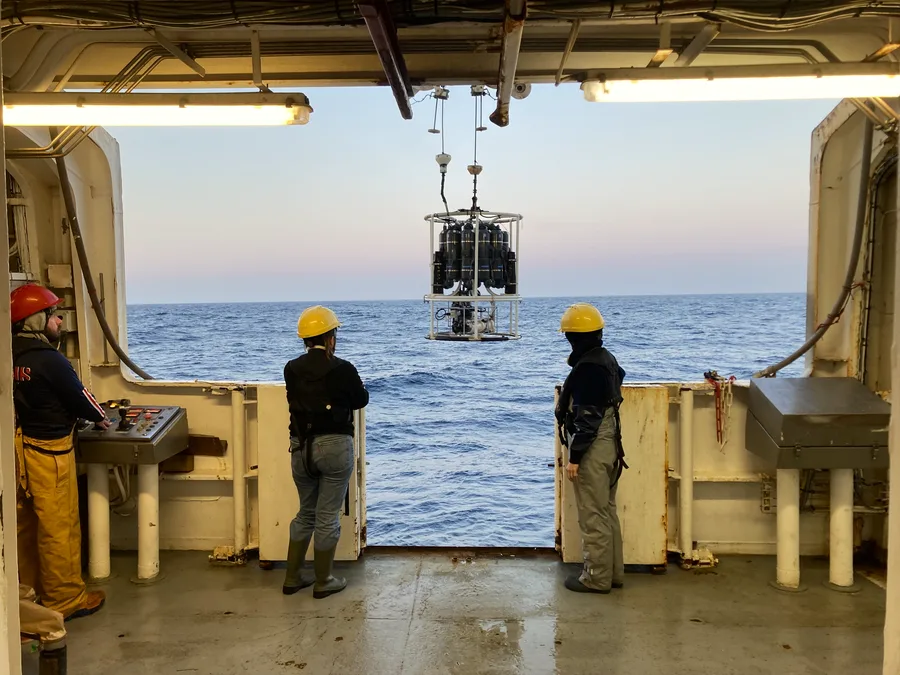
Modern turbidity sensors work on the nephelometric principle: a beam of light is passed through the water sample, and the sensor measures how much of that light scatters at a 90-degree angle off suspended particles, reporting the result in nephelometric turbidity units (NTU) or the closely related formazin nephelometric units (FNU). Field-grade instruments like the YSI EXO2 sonde or ProDSS turbidity sensor package this nephelometer alongside conductivity, temperature, and depth sensors into a single digital probe, so turbidity is typically logged as one channel of a broader water-quality profile rather than measured in isolation.
From NTU to a Number You Can Model
Turbidity, total suspended solids (TSS), and Secchi disk depth are all related measures of the same underlying condition — how much particulate matter is suspended in the water column — but they aren't interchangeable. TSS is measured directly and gravimetrically, following methods such as the American Public Health Association's Standard Method 2540D: a known volume of water is passed through a pre-weighed filter, the filter is dried, and the residue is weighed to give a concentration in milligrams per litre. Because a nephelometer reports scattering intensity rather than mass, turbidity sensors are routinely calibrated against paired TSS lab samples so that an NTU reading in the field can be converted into the mass-based units that water quality standards and sediment transport models actually use.
Why This Number Drives a Go/No-Go Decision
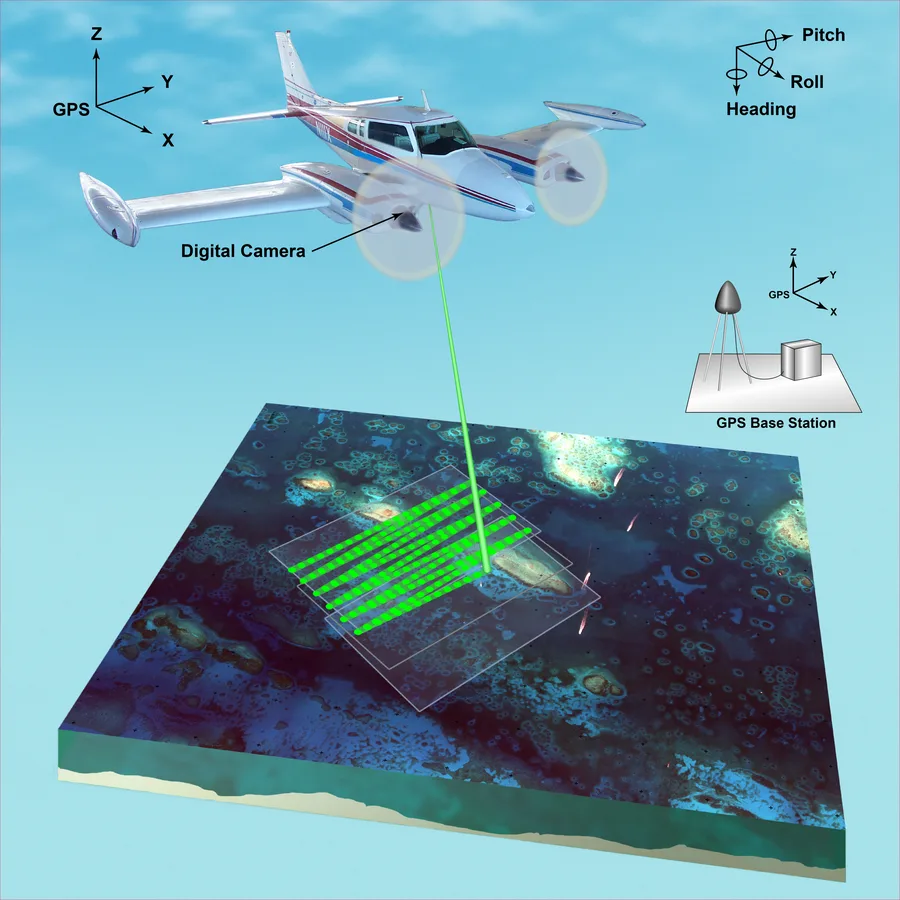
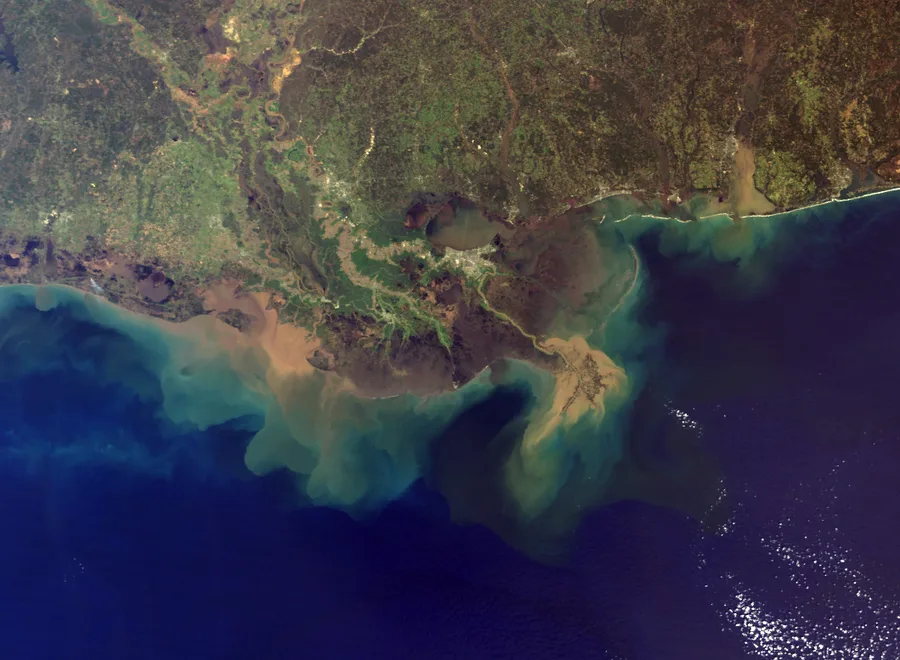
Airborne lidar bathymetry performance is directly limited by how much of the laser's energy survives the round trip through the water column, and turbidity is the dominant variable controlling that loss. Under near-ideal conditions — turbidity below 1 NTU and chlorophyll concentration under 0.8 micrograms per litre over a sandy bed — systems have detected depths past 9 metres; in genuinely turbid water, penetration can fall to 3 metres or less. Survey planning tools built around Secchi depth give a rough rule of thumb for how deep a given lidar system can expect to see, with manufacturer guidance for systems like the Chiroptera citing roughly 1.5 times the Secchi depth as an expected maximum, provided the seabed itself reflects at least 15 percent of the incoming light. Increasingly, providers assess historical and near-real-time water clarity from satellite imagery before ever mobilising an aircraft, using space-based water quality monitoring specifically to time flights for the clearest available conditions rather than discovering turbidity problems after the fact.
Case in Point: Turbidity as a Live Proxy for Sediment Flux at Gomso Bay
A high-resolution fixed-point study in Gomso Bay, a UNESCO-recognised tidal flat on Korea's western coast, tracked turbidity through an entire semi-diurnal tidal cycle using a combined instrument platform: a current meter, a CTD profiler, a tide gauge, and paired water samples analysed gravimetrically for total suspended matter. The vertical turbidity measurements correlated strongly with the gravimetric TSM results, with an R² of 0.94 — a tight enough relationship that the continuously logged turbidity sensor could stand in as a real-time proxy for suspended sediment concentration across the tidal cycle, without needing a lab sample at every timestep.
A Small Measurement With an Outsized Effect on Survey Planning
Turbidity is one of the simplest parameters collected in any coastal survey, and one of the easiest to treat as routine background data — but for anyone planning an optical bathymetry survey, it is closer to a precondition than a footnote. Knowing whether a site sits at 1 NTU or 40 NTU on a given day is often the difference between a lidar mission that resolves the seabed and one that comes back with nothing usable below a few metres.
References
- U.S. Geological Survey, "Turbidity," National Field Manual for the Collection of Water-Quality Data, https://pubs.usgs.gov/twri/twri9a6/twri9a67/twri9a_Section6.7.pdf
- U.S. Geological Survey, "Technical Note — Relative Variability of Selected Turbidity Standards and Sensors in Use by the U.S. Geological Survey," https://www.usgs.gov/publications/technical-note-relative-variability-selected-turbidity-standards-and-sensors-use-us
- "Effect of Turbidity, Temperature and Salinity of Waters on Depth Data from Airborne LiDAR Bathymetry," IOPscience, https://iopscience.iop.org/article/10.1088/1755-1315/925/1/012056
- TCarta, "Enhance Bathy Lidar Collection Planning with Space-Based Water Quality Monitoring," https://tcarta.com/enhance-bathy-lidar-collection-planning-with-space-based-water-quality-monitoring/
- "Site-Specific Net Suspended Sediment Flux and Turbidity–TSM Coupling in a UNESCO Tidal Flat on the Western Coast of Korea," Water (MDPI), https://www.mdpi.com/2073-4441/17/23/3361
- "Estimation of Secchi Transparency in Turbid Coastal Waters," ScienceDirect, https://www.sciencedirect.com/science/article/pii/S2214241X1500142X
Related Articles