Oseanografi
CTD Profiling: The Instrument Behind Every Water Column Story
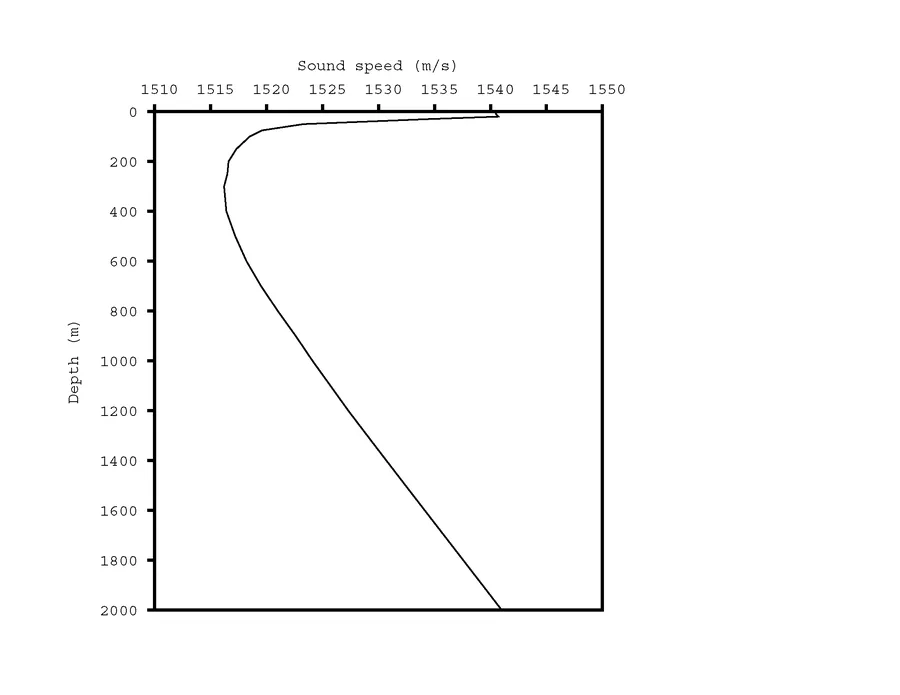
An article elsewhere on this site explains why echosounders need a sound velocity profile to convert travel time into an accurate depth. That profile comes from a CTD — but reducing the CTD to "the sound velocity instrument" undersells it badly. Conductivity, temperature, and depth are the three measurements that, together, describe almost everything a physical oceanographer needs to know about a parcel of seawater: what it's made of, where it came from, and how it will behave relative to the water around it.
Three Measurements, Not Four
A CTD instrument measures exactly what its name says: electrical conductivity, temperature, and pressure (which converts directly to depth). Salinity — arguably the parameter oceanographers actually care about most — isn't measured directly at all. It's calculated from conductivity, temperature, and pressure together, using the equations of the Practical Salinity Scale 1978 (PSS-78), standardised through UNESCO's 1981 routines. Conductivity alone can't tell you salinity, because how well water conducts electricity depends on temperature too; it takes all three raw measurements combined to back out a reliable salinity value.
How a Cast Actually Works
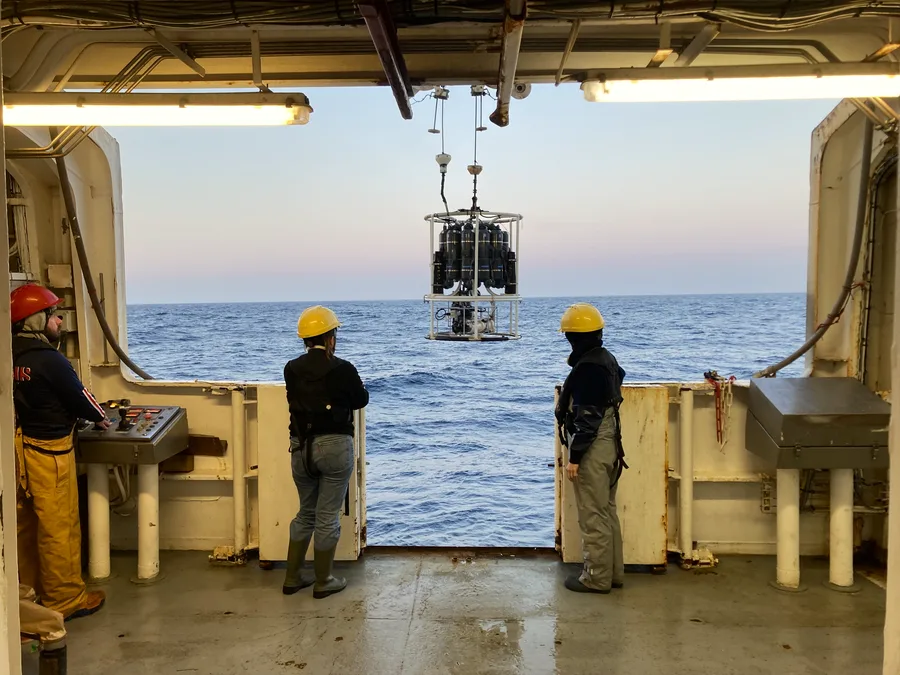
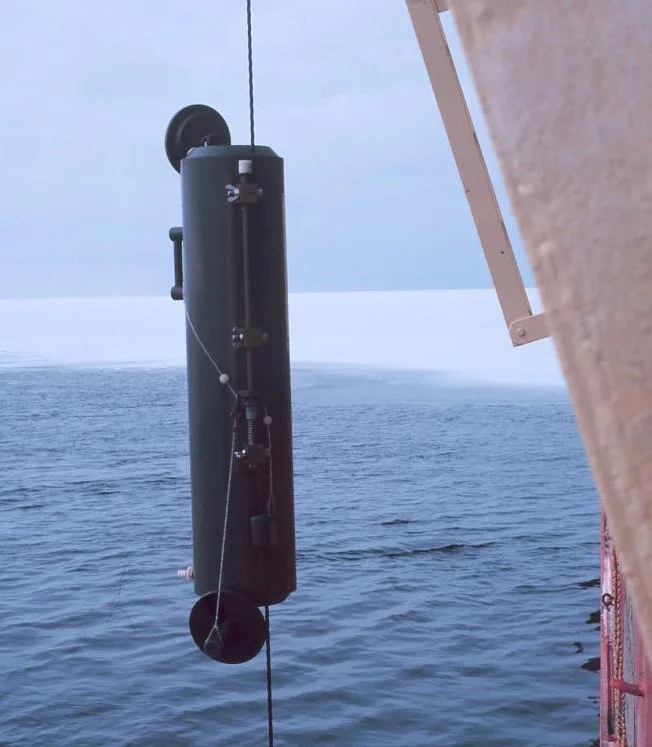
A shipboard CTD is typically mounted on a rosette frame alongside a ring of Niskin bottles — spring-loaded cylinders that can be triggered to seal shut at a specific depth, capturing a physical water sample for later laboratory analysis. The whole assembly is lowered on a conducting cable, streaming conductivity, temperature, and pressure data back to a computer on deck in real time as it descends, which lets the science team watch the water column's structure unfold and decide, on the spot, exactly which depths are worth firing a Niskin bottle to sample.
Reading a Water Mass From a Profile
Once a cast is complete, the resulting temperature and salinity values at each depth can be plotted against each other on a temperature-salinity (T-S) diagram, with density isolines drawn across it as a reference grid. Because different water masses tend to form with characteristic, fairly stable combinations of temperature and salinity, a T-S diagram lets oceanographers identify which water masses are present in a profile and trace how they mix. The vertical profile itself typically resolves into three broad zones: a well-mixed surface layer, a zone of rapid change with depth — the thermocline where temperature falls quickly (a difference of around 20°C across the thermocline is typical at low latitudes), the halocline where salinity shifts fastest, or the pycnocline where density increases fastest — and a deep, comparatively uniform layer below. A pronounced pycnocline is a strong barrier to vertical mixing, since displacing water across it takes a disproportionate amount of energy.
Case in Point: A CTD in Every Ocean, All the Time
The Argo programme scaled the CTD cast from a one-off shipboard event into a standing global observing system. Argo floats drift at depth, descend to roughly 2,000 metres, then rise to the surface on a roughly ten-day cycle, recording a CTD profile on the way up before transmitting the data by satellite and sinking again for the next cycle. Deployment began in 2000, and the array has been sustained since at a rate of roughly 800 to 1,000 new floats per year, contributed by around 26 nations as of 2019, maintaining a global fleet of about 4,000 floats spaced roughly every 3 degrees (about 300 kilometres) across the world's oceans. Between 1999 and 2019 alone, the programme logged more than two million individual temperature-salinity profiles — a scale of continuous water-column sampling that would have been unimaginable to Neil Brown's generation of shipboard CTD casts, and one that now underpins essentially every global ocean data-assimilation model in use today.
One Instrument, Many Downstream Uses
Sound velocity correction for echosounders is a genuinely important use of CTD data, but it's a downstream application, not the instrument's core purpose. At its core, a CTD cast is how oceanography actually observes the water column directly — density structure, water mass identity, stratification — everything that governs how heat, salt, and dissolved gases move through the ocean, measured one profile, or one Argo float, at a time.
References
- Woods Hole Oceanographic Institution, "Conductivity, Temperature, Depth (CTD) Sensors," https://www.whoi.edu/what-we-do/explore/instruments/instruments-sensors-samplers/conductivity-temperature-depth-ctd-sensors/
- NOAA Ocean Exploration, "CTD," https://oceanexplorer.noaa.gov/technology/ctd/
- Salinometry, "Development of CTD-Systems," https://salinometry.com/history-ctd/6/
- Ocean Python, "T-S Diagram," https://oceanpython.org/2013/02/17/t-s-diagram/
- Argo, "Argo's Role in the Observing System," https://argo.ucsd.edu/about/observing-system/
- "Argo Data 1999–2019: Two Million Temperature-Salinity Profiles and Subsurface Velocity Observations From a Global Array of Profiling Floats," Frontiers in Marine Science, https://www.frontiersin.org/journals/marine-science/articles/10.3389/fmars.2020.00700/full
Related Articles