Marine Survey Technology
The Theory Behind Satellite-Derived Bathymetry: How Light Becomes Depth
No ship, no sonar ping, no laser pulse — satellite-derived bathymetry (SDB) estimates how deep the water is using nothing but the color of light reflected back into a camera in orbit. That sounds closer to a trick than a measurement, but it rests on a genuinely simple physical fact: water absorbs light, and it absorbs it in a mathematically predictable way. Everything SDB does is an attempt to run that absorption process backward — from a color, to a depth.
The Physical Basis: Why Water Gets Darker With Depth
Sunlight entering water doesn't travel far before it starts disappearing. Absorption and scattering remove light energy at a rate that grows exponentially with the distance traveled through the water column — the same physical principle, the Beer-Lambert law, that describes light passing through any absorbing medium. Because that relationship is exponential rather than linear, a satellite sensor recording raw reflectance sees a curve, not a straight line, when reflectance is plotted against depth. The standard trick in optical remote sensing for turning an exponential relationship into something a simple regression can handle is to take its logarithm, which is exactly what every practical SDB algorithm since the 1970s has done to reflectance data before trying to relate it to depth.
That absorption isn't uniform across colors, either. Longer wavelengths of light — reds and oranges — are absorbed within the first few meters, while shorter wavelengths — blues and greens — travel much further before fading out, which is the reason clear open ocean looks blue and why SDB algorithms lean specifically on the blue and green bands of a multispectral image rather than red or infrared. A pixel over deep water has had more of its blue-green light absorbed than a pixel over a shallow sandbank, and that difference in brightness is the entire raw signal SDB has to work with.
Lyzenga's Linear Model (1978, 1981, 1985)
David Lyzenga published the first widely used approach to this problem in 1978, later extended in 1981 and 1985. His method log-transforms each spectral band individually, then fits depth as a linear combination of those transformed bands through regression: Z = a₀ + a₁X₁ + aᵢXᵢ, where Z is depth and the a-coefficients are found by regressing known depths (from a chart or a sonar survey) against the transformed satellite reflectance at the same points. It's a workable, well-established model, and it remains the most widely used inversion approach using two or more bands — but it has real limits. It typically can't distinguish depths beyond roughly 15 meters, its accuracy varies noticeably from one site to another, and because it needs five separate parameters, it performs poorly wherever the seabed itself is dark, since a dark bottom and a deep bottom both send back less light for the same underlying reason.
Stumpf's Ratio Refinement (2003)
Stumpf, Holderied, and Sinclair's 2003 model took a different approach to the same underlying physics: instead of log-transforming each band and combining them linearly, it takes the ratio of the logarithms of two bands. That single change has an outsized effect — the ratio largely cancels out variation caused by different seabed materials (sand, bare rock, algae, coral all reflect differently at the surface), because a change in bottom brightness affects both bands in the ratio in roughly the same proportion. With only two tunable parameters instead of five, and clear water conditions, the ratio approach can push usable depth retrieval out to around 25 meters, well past where Lyzenga's linear model gives out, and it holds up more consistently across different sites. The trade-off is that the ratio signal is noisier and cannot resolve fine seafloor features smaller than about 4–5 pixels once depths pass 15–20 meters, and because it fits one global relationship to an entire scene, it can miss local variation in water clarity, bottom type, or atmospheric conditions within that same scene.
From Theory to a Real Depth Map
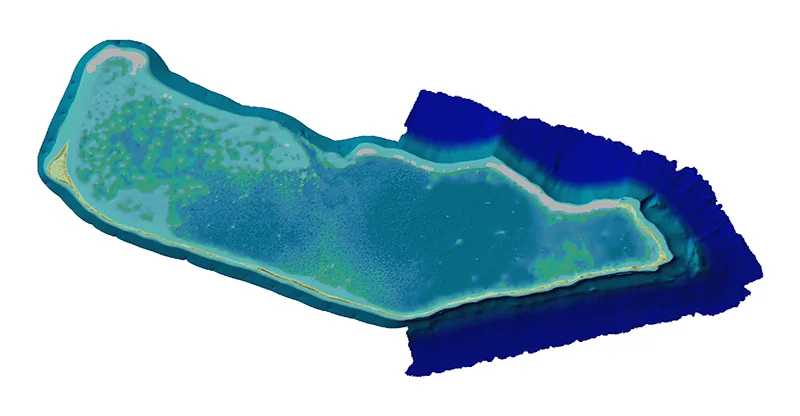
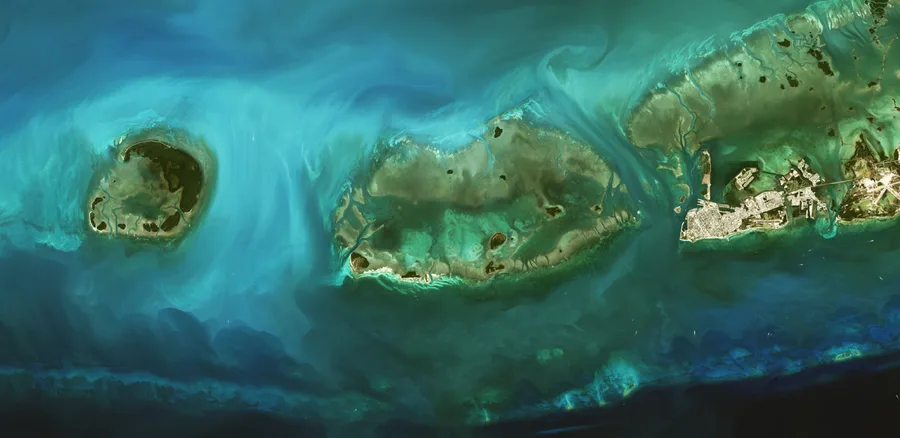
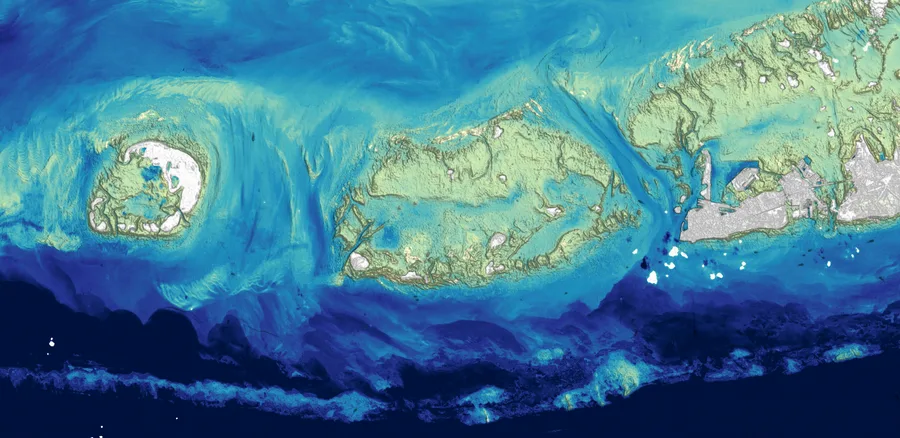
Turning that math into an operational product still requires calibration against real depth measurements — a chart, a sonar survey, or in more recent work, photon-counting laser altimetry from satellites like ICESat-2 — at a subset of points, so the regression has something to fit against. Researchers at the USGS have applied a physics-based variant of this approach to Landsat 8 Operational Land Imager (OLI) data to map shallow coastal water around Guam, Key West, and Puerto Rico, and produced a directly comparable Landsat-derived depth map of the Florida Keys, where shallow channels between the islands and sections of the reef system are clearly visible in the resulting bathymetry. The same underlying logic — log-transform or log-ratio, regressed against known depths — has been applied using Landsat, Sentinel-2, DigitalGlobe WorldView, and PlanetScope imagery, each platform offering a different trade-off between spatial resolution, revisit frequency, and cost.
Where the Theory Still Falls Short, and Why It Still Matters
None of this works if the water is too turbid for light to make the round trip at all, and a model fitted for one stretch of coastline doesn't automatically transfer to another with different water clarity, bottom type, or atmospheric conditions — the same weakness that separates Lyzenga's and Stumpf's approaches from a physically exhaustive model of the water column. But SDB doesn't need to replace a multibeam survey or airborne lidar to be useful; it needs to fill the enormous stretches of shallow coastal water that neither of those methods has gotten around to yet. That's precisely the gap the GEBCO Seabed 2030 initiative is trying to close, and satellite-derived bathymetry — needing no vessel, no laser, nothing but an existing multispectral image and a handful of calibration depths — has become one of the more practical ways to close it.
Conclusion
From Lyzenga's log-linear regression in 1978 to Stumpf's log-ratio in 2003 to today's physics-based variants running on Landsat and Sentinel-2, satellite-derived bathymetry has always been the same basic maneuver: measure how much color a patch of water has lost, and run the Beer-Lambert law backward to find out how far the light must have traveled to lose it. It's an elegant piece of theory precisely because it asks so little of the satellite — no timer, no laser, no acoustic ping — and so much of the physics.
References
- U.S. Geological Survey — Satellite-Derived Bathymetry, Coastal National Elevation Database (CoNED) Applications Project
- U.S. Geological Survey — Physics-Based Satellite-Derived Bathymetry (SDB) Using Landsat OLI Images
- U.S. Geological Survey — USGS Finds New Way to Measure Ocean Depth With Landsat
- NASA Earth Observatory — Landsat Plumbs the (Shallow) Depths
- Stumpf, R.P., Holderied, K., & Sinclair, M. (2003) — Determination of Water Depth With High-Resolution Satellite Imagery Over Variable Bottom Types, Limnology and Oceanography
- ISPRS Archives — Satellite-Derived Bathymetry: Accuracy Assessment on Depths Derivation Algorithm for Shallow Water Area
- Applied Geomatics / Springer — Bathymetry From Satellite Images: A Proposal for Adapting the Band Ratio Approach to IKONOS Data
- Coastal Wiki — Satellite-Derived Nearshore Bathymetry
Related Articles