Geofisika & Geohazard
Mapping Coral Reefs With Acoustic and Optical Data: Two Senses, Not One
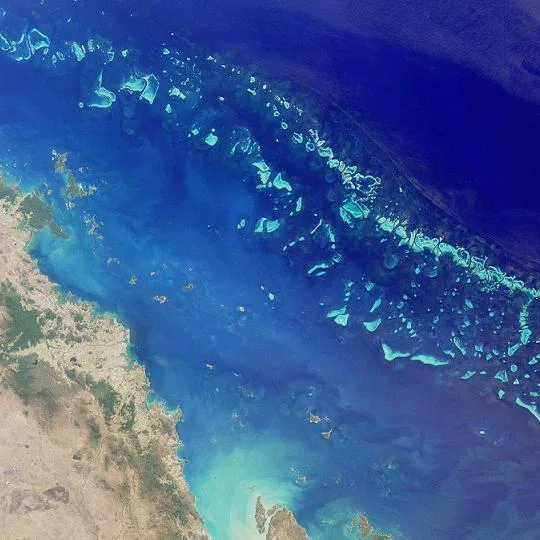
Acoustic instruments tell a survey what shape a reef is — its structure, rugosity, and hardness. Optical instruments, whether a diver's camera or a satellite sensor, tell it what colour the reef is — a proxy for live coral cover, bleaching, and algal overgrowth that sound alone cannot detect. Neither sense is sufficient on its own, and the strongest reef mapping work in the literature is consistently the work that uses both at once.
The Acoustic Side: Side-Scan's Head Start, Multibeam's Case
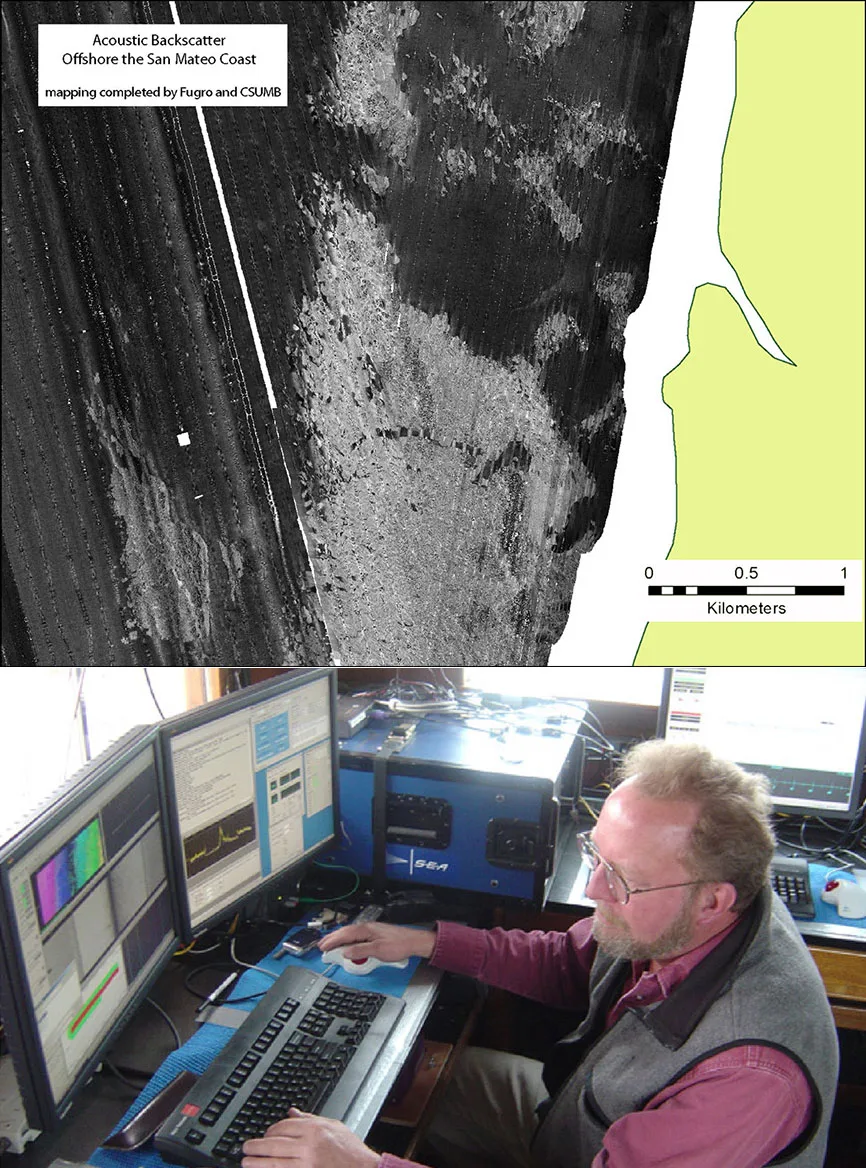
Side-scan sonar has historically been the default acoustic tool for coral reef mapping, and current practice still leans toward it — despite multibeam echosounders being the more cost-effective option, since a single multibeam pass collects bathymetry and backscatter simultaneously rather than requiring a separate instrument pass. As multibeam systems have improved, that historical preference for side-scan increasingly looks like inertia rather than a technical requirement, and integrated schemes now combine airborne laser bathymetry, multibeam echosounder data, and multispectral imagery into a single large-scale, high-precision workflow for coral reef habitat and sediment mapping.
Case in Point: What Combining Sensors Actually Buys You
A study in the western Caribbean tested exactly this combination directly, pairing IKONOS high-resolution satellite imagery with dual-frequency side-scan sonar across coral, seagrass, algal, and bare sediment habitats, classifying each dataset separately and then together. The combined optical-plus-acoustic dataset reached 61 percent accuracy at a coarse classification level and 52 percent at a finer, medium classification level — both significantly higher than either the satellite imagery or the side-scan data could achieve alone, with the combined approach improving classification accuracy by as much as 21 percent over the best single-sensor result. The synergy makes intuitive sense: optical imagery is strong at reading surface colour and cover type in the shallows it can see through, while acoustic data keeps working at depths and turbidity levels where optical light simply doesn't penetrate, and where physical structure and rugosity matter as much as colour.
Case in Point: Reading Bleaching Damage in Acoustic Texture
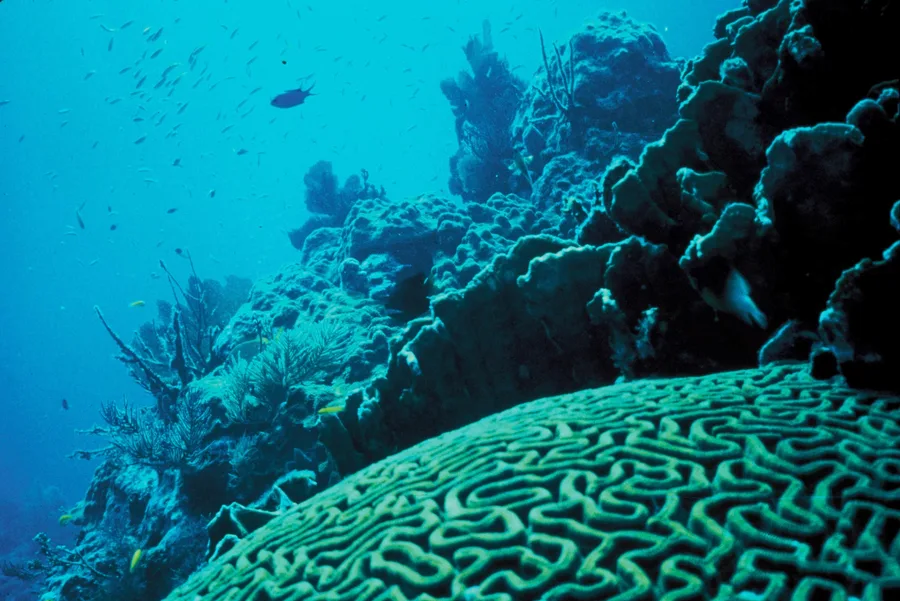
Following the major 1998 Indian Ocean coral bleaching event, researchers ran high-resolution 675 kHz side-scan sonar surveys over Seychelles reefs at six and thirty months after the event, covering four distinct reef morphologies that varied with water depth and distance from shore. Textural analysis of the backscatter — first-order statistics, unsupervised cluster analysis, and Mann-Whitney U-tests — found a clear correlation between backscatter response and reef type, driven by the link between coral community composition and seabed rugosity at scales from millimetres to tens of metres. Branching coral colonies proved to be relatively strong acoustic scatterers, producing a broad intermediate-to-high intensity response, while massive coral colonies and hard carbonate pavement behaved principally as simple reflectors. That distinction let the acoustic data track structural change over the eighteen months between surveys — standing coral versus coral broken down into rubble — without needing a diver to re-photograph every metre of reef in between.
Why the Combination, Not the Instrument, Is the Method
Neither the Caribbean classification study nor the Seychelles bleaching survey treats acoustic or optical data as a replacement for the other — each uses acoustic data for what it does well (structure, rugosity, penetration through depth and turbidity) and optical or textural interpretation for what it does well (live cover, colour, community composition). For coral reef mapping specifically, where both physical structure and biological condition matter to the final assessment, that combination is closer to a requirement than an enhancement.
References
- "Combining Optical and Acoustic Data to Enhance the Detection of Caribbean Forereef Habitats," ScienceDirect, https://www.sciencedirect.com/science/article/abs/pii/S0034425710002026
- "Time-Lapse Side-Scan Sonar Imaging of Bleached Coral Reefs: A Case Study from the Seychelles," ScienceDirect, https://www.sciencedirect.com/science/article/abs/pii/S0034425706005141
- "Comparative Evaluation of Airborne LiDAR and Ship-Based Multibeam SoNAR Bathymetry and Intensity for Mapping Coral Reef Ecosystems," ScienceDirect, https://www.sciencedirect.com/science/article/abs/pii/S0034425709000236
- "Benthic Habitat Sediments Mapping in Coral Reef Area Using Amalgamation of Multi-Source and Multi-Modal Remote Sensing Data," ScienceDirect, https://www.sciencedirect.com/science/article/abs/pii/S0034425724000439
- NOAA Coral Reef Watch, https://coralreefwatch.noaa.gov/
Related Articles
Benthic Habitat Mapping: Turning Backscatter and Ground-Truth Into a Seafloor Ecosystem Map
Applications of Side-Scan Sonar in Underwater Surveys