Hidrografi
Inland Bathymetric Survey: Rivers, Lakes, and Reservoirs
Most bathymetric survey stories involve a vessel, an ocean, and a multibeam array pointed at the seafloor. But a large share of the world's bathymetric surveying happens nowhere near the coast — on drinking-water reservoirs, hydropower dams, and rivers, where the questions are just as serious (how much water can this reservoir actually hold? is a dam silting up faster than expected?) but the water itself imposes an entirely different set of constraints.
Why Inland Water Needs Its Own Survey Approach
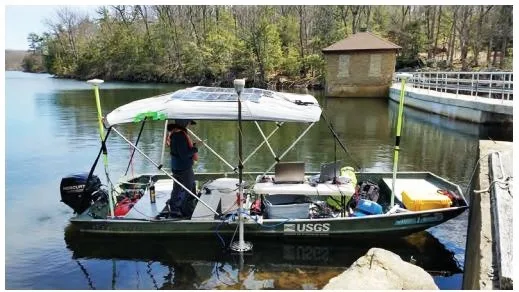
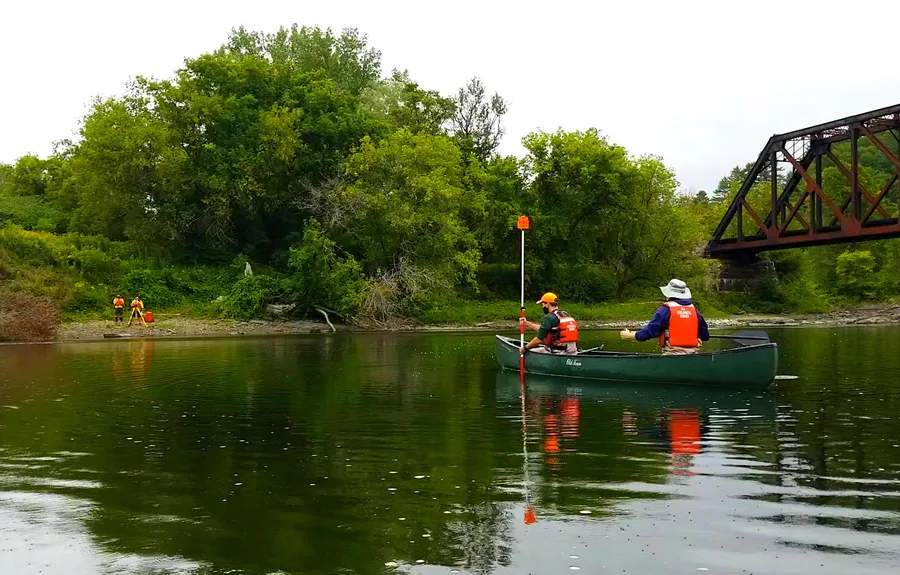
A river or a small reservoir arm can be too shallow, too narrow, or too cluttered with vegetation for anything resembling an offshore survey vessel. Inland survey work is built around that reality: multi-beam and single-beam echosounders remain the core tools, but they get mounted on much smaller platforms — an 18-foot cargo canoe for a tight cove, a 22-foot cabin boat for open reservoir water, or, where even a canoe can't go, a hand-portable unmanned surface vehicle. A system like the HyDrone-RCV is a compact, remote-controlled catamaran with roughly a 2-kilometre control range and over four miles of endurance on a single battery, purpose-built to carry a small echosounder into water a person can't safely wade into and a boat can't safely launch. Paired with a portable single-beam unit like the HydroLite-TM Plus — a 200 kHz sounder rated to 1 cm or 0.1% depth accuracy across a 0.3 to 75-metre range — a two-person crew can survey a contaminated lake, a narrow irrigation canal, or a river with difficult bank access without ever putting a person in the water.
Aquatic vegetation is a recurring complication that has no real coastal equivalent: dense summer weed growth can confound an echosounder's bottom-detection algorithm, and surveyors often have to time fieldwork around seasonal vegetation cycles or accept noisier data during peak growth. For water bodies genuinely inaccessible to any boat, some research programs have gone further still, tethering a small sonar unit beneath an unmanned aerial vehicle — a method demonstrated to achieve roughly 2.1% depth accuracy in water up to about 35 metres deep, without a vessel of any kind touching the water.
The Vertical Datum Problem
Coastal hydrography has an enormous natural stabilizer working in its favour: the ocean itself, which makes tidal datums — mean lower low water, mean sea level, and the rest — predictable enough to compute from years of tide-gauge records. Inland water has no such luxury. A lake or reservoir has no ocean holding its level steady, so the water surface an inland surveyor is measuring against can shift by metres between wet and dry seasons, and even between one hydropower release and the next.
The practical fix is a different family of vertical references entirely: instead of tidal datums, inland surveys work against terms like Full Pool Level, Minimum Regulated Pool, and Low Water Reference Plane — elevations tied to a reservoir's actual operating rules rather than to a tidal cycle. A common convention for non-tidal chart datum is to set it low enough that the water surface sits above it roughly 95% of the time, with guidance that the daily mean level should rarely drop more than about 0.2 metres below that reference during the navigation season. Getting this datum choice wrong doesn't just shift a number on a chart — it changes how much usable storage capacity a reservoir appears to have on paper, which is exactly the number many of these surveys exist to answer.
What These Surveys Are Actually For
A 2019-2020 USGS survey of twelve water-supply lakes in northwestern Missouri illustrates what inland bathymetric data is actually used to answer. Surveyors used boat-mounted multibeam systems on both a 22-foot cabin boat and an 18-foot cargo canoe, supplemented by ADCP data collected from remote-controlled boats in areas too shallow for a crewed vessel. Comparing the new surveys against historical data, all six lakes with prior surveys showed measurable capacity loss — from a modest 0.8% at Lake Viking to a striking 21.4% at Middle Fork Grand River Reservoir. Sedimentation rates across most lakes ran between 0.54 and 4.19 acre-feet per year, though Lake Viking's sediment accumulation of 14.9 acre-feet per year stood out as unusually high relative to its modest capacity loss — a discrepancy the survey team linked to dredging operations visible in the bathymetric data itself.
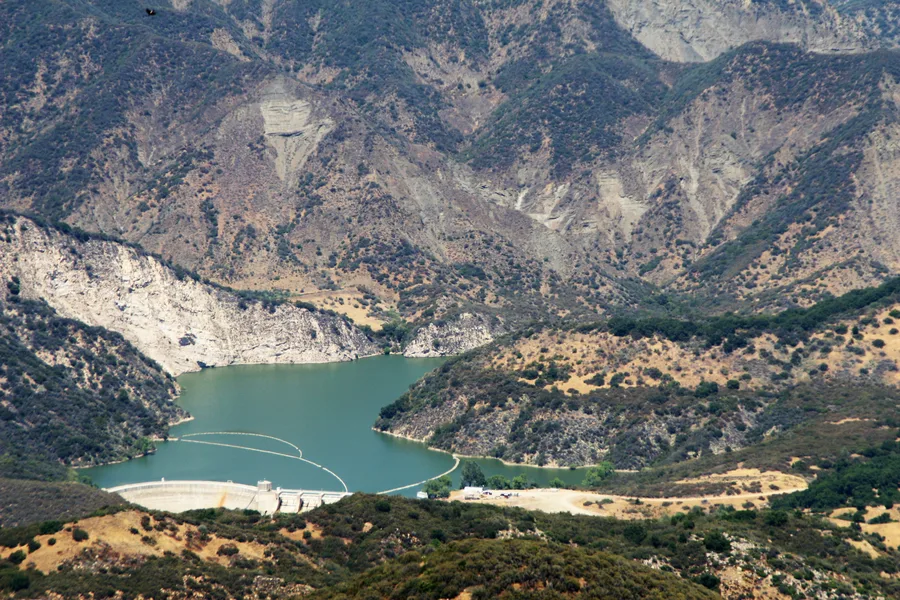
A 2022 case study of the Meka Dam reservoir in Ethiopia's Oromia region shows how stark these numbers can get in a heavily farmed watershed. Surveyors collected 3,025 depth points at a 10-metre horizontal spacing, comparing the reservoir's condition against its 2007 construction baseline. The reservoir's usable storage capacity above the accumulated silt had dropped to 9,276,000 cubic metres from an original 119,960,000 cubic metres — a loss of 17.86%, or roughly 2.4 million cubic metres of sediment, in just fifteen years. With cropland covering an estimated 75% of the watershed and farming encroaching on buffer zones, the study projected the reservoir could reach half its remaining useful life within 42 years if sedimentation continued at the observed rate — a serious concern for the roughly 150,000 residents of Nekemte town who depend on it for water supply.
Small Water Bodies, Same Rigor
Neither the Missouri lakes nor the Meka Dam reservoir looks anything like an offshore survey site — no vessel over a few metres long, no swells, no tidal correction. But the questions those surveys answer (how much capacity does this reservoir actually have left, and how fast is that changing) carry exactly the same weight as anything measured at sea, because a community's drinking water, a dam's flood-storage margin, or a hydropower plant's generating capacity is riding on the answer. The instruments shrink to fit the water, the datum gets rebuilt around a pool elevation instead of a tide, but the underlying discipline — measure carefully, reference it correctly, and repeat it on a schedule that catches change before it becomes a crisis — doesn't change at all.
References
- USGS, "Bathymetric Contour Maps, Surface Area and Capacity Tables, and Bathymetric Change Maps for Selected Water-Supply Lakes in Northwestern Missouri, 2019 and 2020," https://pubs.usgs.gov/publication/sim3486/full
- Assessment of the Impact of Agricultural Activity on Siltation of Meka Dam Reservoir in the Chancho Catchment Using Bathymetric Survey and GIS, Ethiopia Oromia Region Nekemte, International Journal of Engineering Management, https://www.sciencepublishinggroup.com/article/10.11648/j.ijem.20250902.12
- Technical Note: Bathymetry Observations of Inland Water Bodies Using a Tethered Single-Beam Sonar Controlled by an Unmanned Aerial Vehicle, Hydrology and Earth System Sciences (HESS), https://hess.copernicus.org/articles/22/4165/2018/
- Seafloor Systems, "HyDrone-RCV Portable, Remote Control Survey Boat," https://www.seafloorsystems.com/hydrone
- Seafloor Systems, "HydroLite-TM Plus Single-Frequency Echosounder Kit," https://www.seafloorsystems.com/singlebeam
- U.S. Army Corps of Engineers, EC 1110-2-6070, https://planning.erdc.dren.mil/toolbox/library/ECs/EC1110-2-6070_1Jul2009.pdf
- NOAA, "Tidal Datums and Their Applications," https://tidesandcurrents.noaa.gov/publications/tidal_datums_and_their_applications.pdf
Related Articles