Geofisika & Geohazard
Marine Controlled-Source Electromagnetics: Finding Hydrocarbons by Their Resistivity, Not Their Shape
Seismic reflection can map a subsurface structure in exquisite detail — a dome, a fault trap, a sealed anticline — without ever answering the question that actually matters to a drilling budget: is that trap actually filled with oil or gas, or is it just as likely full of the same salt water that saturates the rock around it? Marine controlled-source electromagnetic (CSEM) surveying exists to answer that second question. Instead of reading contrasts in acoustic impedance, it reads contrasts in electrical resistivity — a property that hydrocarbons and brine express so differently that the presence of oil or gas can, under the right conditions, be inferred directly from how a seafloor-injected electric field decays.

How a Marine CSEM Survey Actually Runs
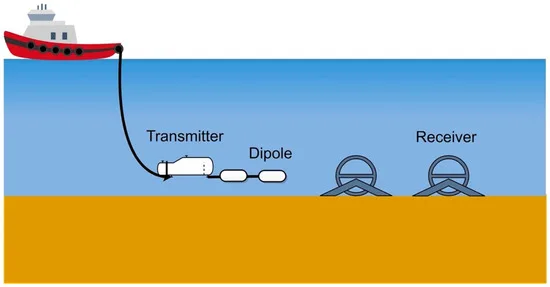
A CSEM survey vessel tows a horizontal electric dipole source at a constant altitude of roughly 25 to 100 metres above the seafloor, following bathymetry as it goes. That source transmits a controlled, continuous low-frequency signal — typically somewhere in the 0.1 to 10 Hz range — through the seawater and into the sediment below, at currents that on commercial systems can reach up to around 1,000 amps. An array of receivers sits on the seabed itself, each recording the amplitude and phase of the electric and magnetic fields that arrive after diffusing through the earth, at source-to-receiver offsets that can extend out to roughly 10 kilometres. As the vessel tows the source along a survey line, every receiver logs a continuous curve of signal strength against offset distance — and it is the shape of that curve, not a single snapshot, that carries the exploration signal.
The Physics: Why Resistivity Tells a Different Story Than Density
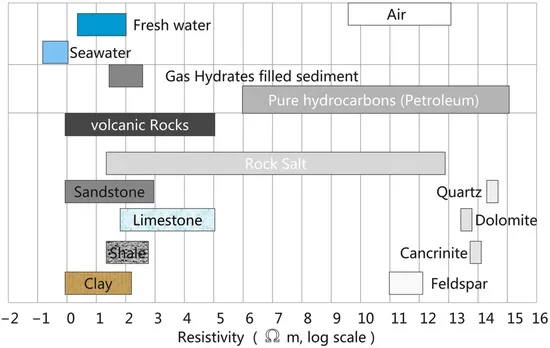
The entire method rests on one physical fact: rock saturated with oil or gas is dramatically more electrically resistive than the same rock saturated with the salt water that normally fills its pore space, because hydrocarbons themselves do not conduct electricity while brine does. Published resistivity studies put hydrocarbon-saturated reservoir sand in the range of roughly 100 to 1,000 ohm-metres, against background brine-saturated sediment and seawater sitting around 0.5 to 2 ohm-metres — a contrast on the order of 5 to 100 times. An electromagnetic field diffusing through a resistive hydrocarbon layer attenuates far more slowly with distance than one passing through the conductive brine-saturated rock around it, so a receiver positioned beyond a resistive reservoir records a measurably stronger signal at long offset than the background trend alone would predict. That is the anomaly a CSEM survey is built to detect — governed by the same Maxwell's equations that describe any diffusive electromagnetic field, but applied here to a target seismic cannot resolve on its own, because seismic impedance depends on density and velocity, properties that barely distinguish a hydrocarbon-filled rock from a brine-filled one of the same lithology.
A Short History: From Deep-Sea Magnetotellurics to an Oilfield Tool
The method's roots are academic, not commercial. In the 1960s, Scripps Institution of Oceanography researcher Charles "Chip" Cox and his student Jean Filloux made the first deep-sea measurements of magnetic and electric fields on the seafloor, using them to produce the first magnetotelluric estimates of oceanic crustal conductivity. Through the 1970s and 1980s, Cox's group extended the work with a deep-towed transmitter dragged across sedimented seafloor to actively probe the resistivity structure of the oceanic lithosphere — pure geophysical research into the earth's crust, with no exploration application in mind. Exxon filed the first patent applying the concept to oil and gas exploration in 1981, but the idea sat largely dormant for over a decade.
The turn toward commercial use began at Statoil in 1997, where geophysicists Terje Eidesmo and Svein Ellingsrud, working with feasibility modelling from the Norwegian Geotechnical Institute, built the case for using CSEM to detect hydrocarbons directly. Statoil financed the test that proved it: a November 2000 survey over the Girassol field offshore Angola, in roughly 1,200 metres of water, using seafloor receivers built by Scripps and an active source developed by a Cambridge University team. The survey targeted a reservoir whose location was already known from drilling, and it found what the physics predicted — a roughly tenfold increase in electric field strength over the reservoir compared with the surrounding background. That result is widely credited as the start of the modern commercial CSEM industry. Within two years, the Norwegian team spun off their technology as Electromagnetic Geoservices (EMGS), founded in Trondheim on 1 February 2002, while the Cambridge group formed Offshore Hydrocarbon Mapping and the Scripps-linked team formed AGO — three companies born out of a single successful survey. EMGS listed on the Oslo Stock Exchange in March 2007, the same year Eidesmo and Ellingsrud received the Society of Exploration Geophysicists' Virgil Kauffman Gold Medal for the work.
The Airwave Problem: Why CSEM Struggles in Shallow Water
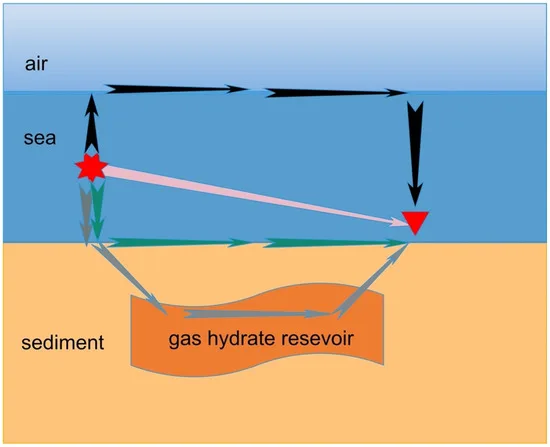
CSEM's most persistent technical limitation is what the industry calls the airwave: in shallow water, some of the transmitted electromagnetic energy travels upward from the source, races through the highly resistive air above the sea surface — where it attenuates far less than it would traveling through conductive seawater or sediment — and re-enters the water to reach the receivers. Because air is so much more resistive than either seawater or a hydrocarbon reservoir, this airwave path can arrive at long offsets stronger than the genuine subsurface signal the survey is trying to measure, effectively drowning out the reservoir response. The effect scales with water depth: it is a minor nuisance in deep water and a dominant, often survey-limiting problem in water shallower than a few hundred metres, which historically confined commercial CSEM to deepwater plays. Addressing it directly shaped later system designs — PGS, for instance, developed a towed-streamer configuration with both source and receivers towed behind the vessel together, aimed specifically at making CSEM workable in water depths under 500 metres where the classic seafloor-receiver geometry struggles most with airwave contamination.
Beyond Oil: Mapping Gas Hydrates in the South China Sea
The same resistivity contrast that flags conventional hydrocarbons also flags gas hydrates — ice-like structures of methane trapped within pore water — since hydrate-bearing sediment is likewise far more resistive than the water-saturated sediment around it, with published logs showing resistivity shifting from around 3 ohm-metres in hydrate-free sediment up to roughly 200 ohm-metres where hydrate saturation is high. In the Shenhu area of the South China Sea, researchers deployed a deep-towed transmitter-receiver CSEM system along a 13-kilometre survey transect using a 500-amp transmitter, achieving near-seafloor resolution of roughly 20 to 100 metres — fine enough to delineate the hydrate-bearing caprock layer directly. The survey identified a laterally continuous high-resistivity anomaly of around 10 ohm-metres running from the base of the gas hydrate stability zone up to the seafloor, and that anomaly correlated with the bottom-simulating reflector visible in seismic data at the same site — a direct demonstration of CSEM's resistivity read and seismic's structural read confirming the same feature from two independent physical measurements.
Where CSEM Fits Today
Marine CSEM is not displacing seismic and was never positioned to; its value is as a discriminator layered on top of a seismic interpretation that has already identified a candidate structure. Current interest spans Australia's North West Shelf, Southeast Asia, southern Africa, the Mediterranean, and the Gulf of Mexico, generally for the same two jobs the method has always done well: distinguishing a hydrocarbon-charged prospect from a wet one before committing to an exploration well, and characterising reservoir extent and fluid content once a discovery is already made. The lesson the industry took from its own early stumbles — that CSEM data analysed on its own tends toward ambiguity, while CSEM integrated with seismic tends toward a defensible answer — remains the operating principle for how the method is used today.
References
- "Electromagnetic Geoservices," Wikipedia, https://en.wikipedia.org/wiki/Electromagnetic_Geoservices
- "Renewed Interest in CSEM in Oil and Gas Exploration," GeoExpro, https://geoexpro.com/renewed-interest-in-csem-in-oil-and-gas-exploration/
- Steven Constable, "Ten years of marine CSEM for hydrocarbon exploration," Geophysics 75(5), Scripps Institution of Oceanography, https://marineemlab.ucsd.edu/~steve/bio/Geophysics75.pdf
- "Obituary Notice — Charles Cox: Esteemed Scripps Professor of Oceanography," UC San Diego Today, https://today.ucsd.edu/story/obituary_notice_charles_cox_esteemed_scripps_professor_of_oceanography
- Scripps Institution of Oceanography Seafloor Electromagnetic Methods Consortium, "Vulcan: A deep-towed CSEM receiver," https://marineemlab.ucsd.edu/semc.html
- "Resistivity of reservoir sandstones and organic rich shales on the Barents Shelf: Implications for interpreting CSEM data," Geoscience Frontiers, ScienceDirect, https://www.sciencedirect.com/science/article/pii/S1674987120301870
- "Gas Hydrate Exploration Using Deep-Towed Controlled-Source Electromagnetics in the Shenhu Area, South China Sea," Journal of Marine Science and Engineering, https://doi.org/10.3390/jmse13091665
- "An Introduction to the Application of Marine Controlled-Source Electromagnetic Methods for Natural Gas Hydrate Exploration," Journal of Marine Science and Engineering, https://www.mdpi.com/2077-1312/11/1/34
Related Articles
Electrical Resistivity Tomography: Mapping the Seabed With Current Instead of Sound
Applications of Marine Magnetometers and Gradiometers: The Instrument That Sees Iron, Not Shape