Marine Survey Technology
Quality Assurance and Quality Control in Hydrographic and Geophysical Survey Data
A hydrographic chart or a geophysical seabed model is only as trustworthy as the uncertainty budget behind it — and that budget is built twice: once in advance, as a prediction of how accurate the data should be, and once after the fact, as a measured confirmation that it actually was. The gap between those two numbers, and the discipline required to keep it small, is what quality assurance and quality control in marine survey actually means.
Two Kinds of Uncertainty: Predicted and Proven
The IHO's S-44 standard (Edition 6.1.0) frames data quality through Total Propagated Uncertainty (TPU), which combines Total Horizontal Uncertainty (THU) and Total Vertical Uncertainty (TVU) into a single confidence figure for every depth and position a survey produces. The standard draws a sharp distinction between two ways of arriving at that figure. A priori uncertainty is predictive — it is calculated in advance from the full error budget of the survey system: GNSS positioning error, IMU and gyro alignment error, sound velocity error, motion sensor error, and the residual boresight error left over from the last patch test, all propagated mathematically into an expected uncertainty before a single line is even surveyed. A posteriori uncertainty is validated — it is measured after the fact, either through repeatability of the same location surveyed twice or through a formal crossline-to-mainscheme comparison, specifically to confirm that what the system actually delivered agrees with what the a priori budget predicted it would.

Building the A Priori Budget: The Verification Chain
An a priori uncertainty figure is only as good as the calibration chain feeding it. That chain runs through several distinct steps, each catching a different category of systematic error: GNSS verification against a known control point, IMU alignment to confirm the inertial system's reported attitude matches reality, gyro calibration for heading accuracy, a multibeam patch test to solve residual boresight angles in roll, pitch, and yaw plus any timing latency between position fix and sonar ping, and — where a USBL system is used for subsea positioning — a separate USBL calibration. Skip or degrade any one link in that chain and the a priori figure stops being a genuine prediction; it becomes an optimistic guess dressed up as a calculation.
Field Validation: Sound Velocity and Crossline Comparison
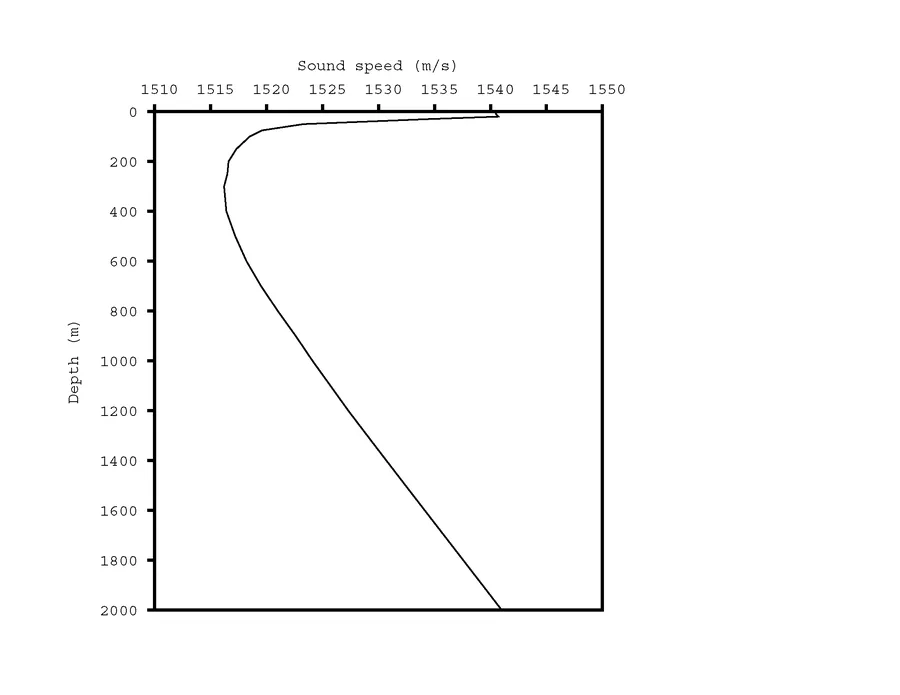
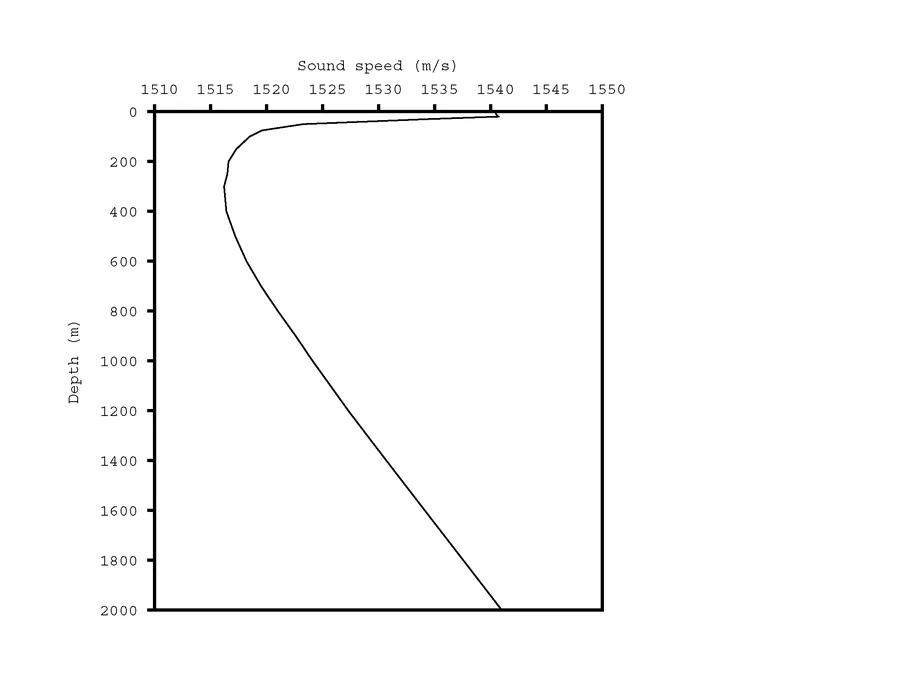
Two field practices carry most of the weight in a posteriori validation. The first is a daily Sound Velocity Profile (SVP) cast, compared day-to-day rather than assumed constant — sound speed in seawater varies with temperature, salinity, and depth, and a stale SVP silently degrades depth accuracy across an entire day's data before anyone notices. The second is overlap or crossline analysis: running a check line that deliberately crosses the main survey lines at an angle, then comparing depths at every point where the two data sets overlap. Systematic disagreement at those crossing points is usually the clearest available evidence of an uncorrected sensor offset, an outdated sound velocity profile, or a tidal correction error — the kind of error that a single line of data, examined in isolation, would never reveal.
Case Study: What a Passing Crossline Comparison Actually Looks Like
A NOAA hydrographic survey, documented in Descriptive Report H12717, illustrates a posteriori validation in practice. The survey team performed a beam-by-beam comparison between crossline data and the main survey scheme, referenced against a 2-metre CUBE-weighted BASE surface — a standard NOAA processing approach that produces a single best-estimate depth surface from overlapping soundings. The comparison found agreement well above 95% of the allowable TVU threshold defined for that survey, meaning the overwhelming majority of crossline depth differences fell comfortably inside the vertical uncertainty the a priori budget had predicted. That result is the entire point of the exercise: not a perfect zero-difference match, which no real acoustic system produces, but a measured confirmation that the predicted uncertainty budget was realistic rather than optimistic.
Why This Distinction Matters Beyond the Paperwork
Treating a priori and a posteriori uncertainty as the same thing — or worse, reporting only the a priori figure as if it were proven — is the single most common way a survey's stated data quality diverges from its actual data quality. A calibration chain can be followed correctly and an a priori budget calculated honestly, and the data can still fail a crossline comparison if a sensor drifted after the last patch test, if the SVP cast wasn't repeated often enough, or if a tidal correction was applied incorrectly. QA/QC exists specifically to catch that gap before the data reaches a chart, an engineering design, or a legal boundary determination — all downstream uses where an uncaught systematic error is far more expensive to fix than it would have been at the crossline stage.
Quality Is a Measured Outcome, Not an Assumed One
A survey's uncertainty figure is only meaningful once it has been checked against reality, not just calculated from a specification sheet. The chain from GNSS verification through patch testing builds a credible a priori prediction; daily SVP casts and crossline comparison provide the a posteriori evidence that the prediction held. Neither step substitutes for the other, and a survey that skips the second step, however well the first was executed, has not actually demonstrated the data quality it reports — it has only asserted it.
References
- International Hydrographic Organization, "S-44 Standards for Hydrographic Surveys, Edition 6.1.0," https://iho.int/uploads/user/pubs/standards/s-44/S-44_Edition_6.1.0.pdf
- Hydro International, "S-44 and the Systematic Error," https://www.hydro-international.com/content/article/s-44-and-the-systematic-error
- International Hydrographic Review, "Survey Systems Verification and Calibration in the Hydrospatial Domain," https://ihr.iho.int/articles/survey-systems-verification-and-calibration-in-the-hydrospatial-domain/
- IHO HSWG5, "Calculations for THU in S-44," https://iho.int/uploads/user/Services%20and%20Standards/HSWG/HSWG5/HSWG5_11_4_a_Calculations%20for%20THU%20in%20S-44.pdf
- NOAA, Descriptive Report H12717, https://data.ngdc.noaa.gov/platforms/ocean/nos/coast/H12001-H14000/H12717/DR/H12717_DR.pdf
Related Articles