Hidrografi
Long-Term Tide Gauge Monitoring: Why a Sea Level Trend Isn't What It Looks Like
Predicting tomorrow's tide, covered elsewhere on this site, is a short-term problem — hours to days, solved with harmonic constituents. Detecting sea level rise is the opposite kind of problem: it needs decades of the same tide gauge's monthly averages, and even then, the number that comes out the other end isn't automatically a climate signal. A rising trend at a single tide gauge can just as easily be the ground sinking as the ocean rising — and separating the two is the entire discipline.
The Archive Behind the Trend Lines
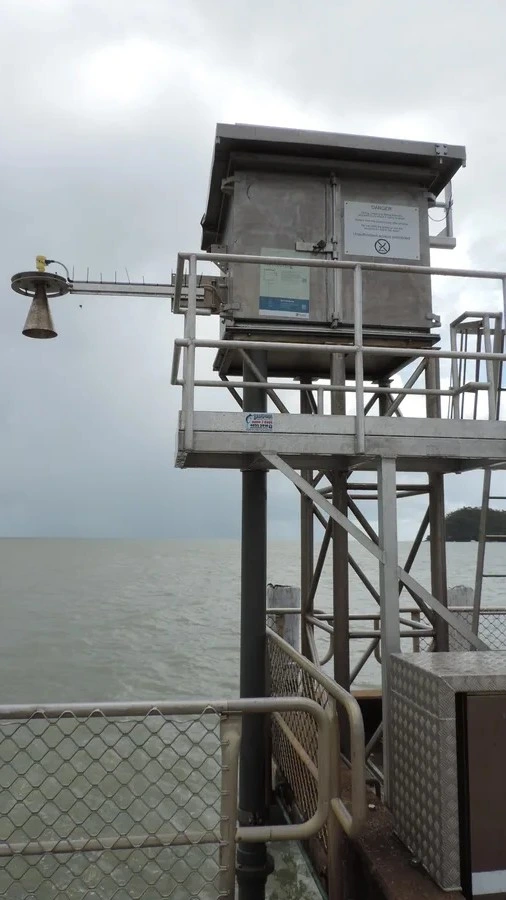
The Permanent Service for Mean Sea Level (PSMSL), based at the National Oceanography Centre in Liverpool, is the global data bank for long-term sea level change, drawing on a network of more than 2,000 tide gauge stations. Originally founded in 1933 as the IUGG Mean Sea Level Committee and adopted as a Permanent Service of the International Council for Science in 1958, PSMSL doesn't just archive raw readings — its Revised Local Reference (RLR) dataset ties each station's records to a common, continuously re-surveyed local benchmark, so that monthly and annual mean values stay comparable to each other across decades even as the physical gauge equipment is repaired or replaced.
Turning that archive into a trend requires patience: changes in relative sea level are typically computed only at stations with a minimum of 30 years of observation, with values averaged by month specifically to remove the higher-frequency noise — storm surges, seasonal cycles, individual extreme tides — that would otherwise swamp a slow multi-decadal signal. Thirty years is a floor, not a target; the longer the record, the more confidently a linear trend can be separated from natural variability.
What Moves the Land Under the Gauge
Vertical land motion (VLM) at a tide gauge site comes from several distinct sources, each with its own timescale. Glacial isostatic adjustment (GIA) — the solid Earth's ongoing rebound from the weight of ice-age glaciers — behaves as an approximately constant rate over roughly a century, easy to model but slow-acting. Local subsidence is far more variable: compaction from groundwater or hydrocarbon extraction is a major driver of vertical land motion, particularly pronounced in river deltas, where subsidence rates can reach several millimetres per year. Tectonic motion adds a third, geography-specific term, with interseismic strain producing uplift of several millimetres per year along parts of the western U.S. coastline. None of these three sources is included in standard global sea level projections, which is precisely why a single tide gauge's raw trend can diverge sharply from the global mean.
Correcting the Record With GPS
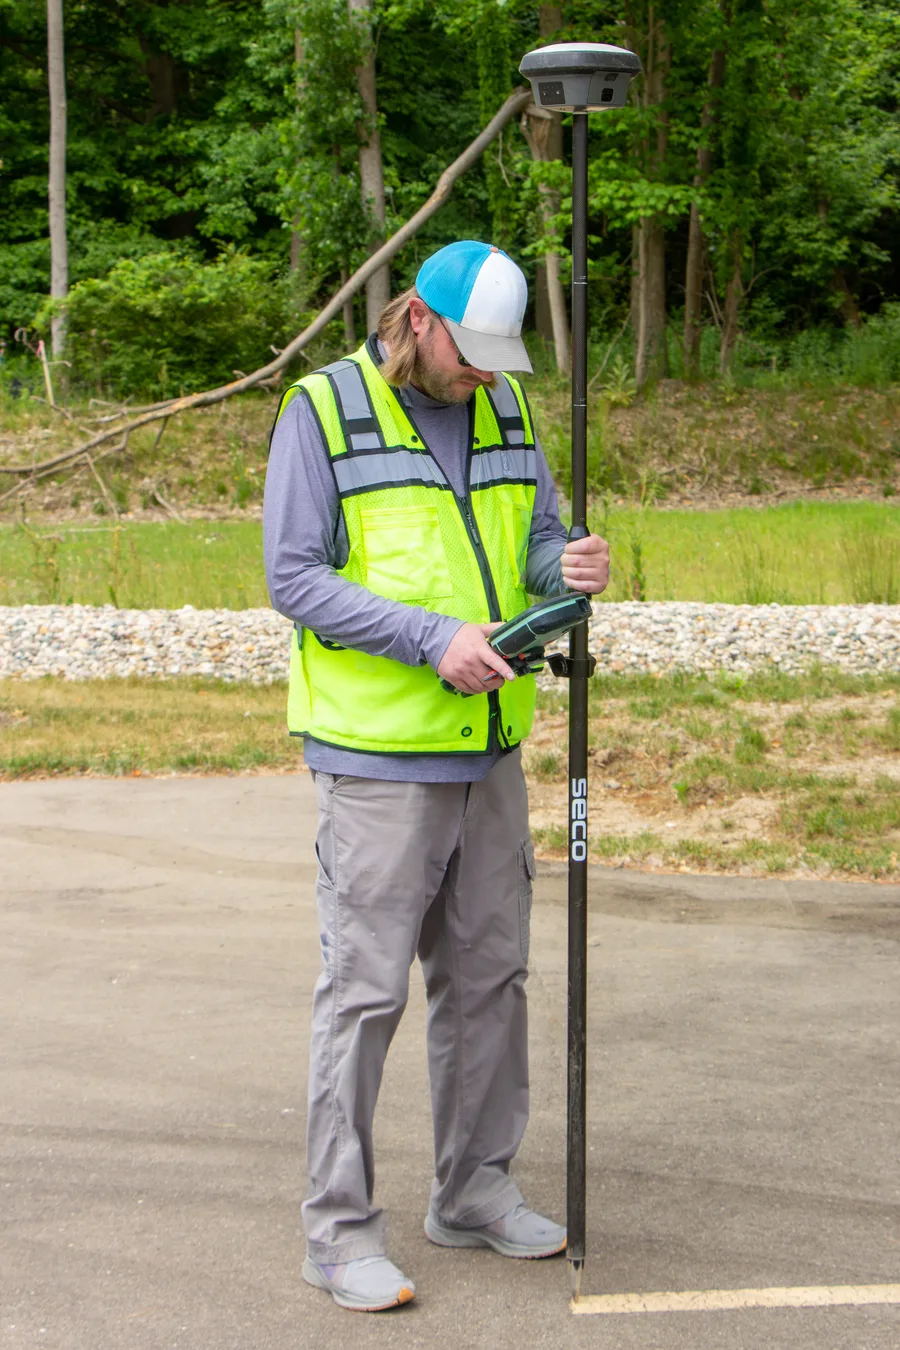
The standard fix is to co-locate a continuous GPS (CGPS) station at the tide gauge itself, measuring the benchmark's vertical velocity directly, then add that GPS-derived land motion rate to the tide gauge's relative sea level trend to produce a motion-adjusted record. The European Sea Level Observing System working group extended this into a dual-CGPS concept: one station at the gauge to capture local land movement, and a second a few kilometres inland on stable rock, improving confidence in what the first station's velocity actually represents. The correction has a built-in limitation, though — GPS records at most sites only extend back one to two decades, while many tide gauge records run past a century, so applying a GPS-derived rate to the full historical record requires assuming the vertical motion has stayed linear over a much longer span than GPS has actually observed it.
Case in Point: When Subsidence Outruns the Ocean at Galveston
The Galveston Pier 21 tide gauge in Texas, with a continuous record dating to 1904, illustrates just how large the land-motion component can be. The station's raw relative sea level trend runs at roughly 6.51 millimetres per year, totalling about 0.7 metres of relative rise since 1909 — but the actual absolute (eustatic) sea level rise contributing to that number is only about 1.10 millimetres per year, the uniform rate estimated for the Gulf of Mexico prior to 1992. Land subsidence accounts for the remaining 76 to 85 percent of the observed trend.
Researchers combining GPS stations, thirteen borehole extensometers tracking aquifer-system compaction since the 1970s and 1980s, and a coupled groundwater-flow and subsidence model were able to break that subsidence down further: primary compaction driven by groundwater extraction contributed about 2.56 millimetres per year during the peak withdrawal period of 1937 to 1983 (36 percent of the total), aquifer-system creep added roughly 0.83 to 0.87 millimetres per year, and deeper tectonic and bedrock subsidence contributed about 2.67 millimetres per year. The subsidence rate itself changed sharply over time — 3.53 millimetres per year from 1909 to 1937, more than doubling to 6.08 millimetres per year during the heavy-groundwater-withdrawal years of 1937 to 1983, then easing to 3.51 millimetres per year from 1983 onward as pumping was curtailed. None of that structure would be visible from the raw tide gauge trend alone.
Why the Raw Number Is Never the Final Answer
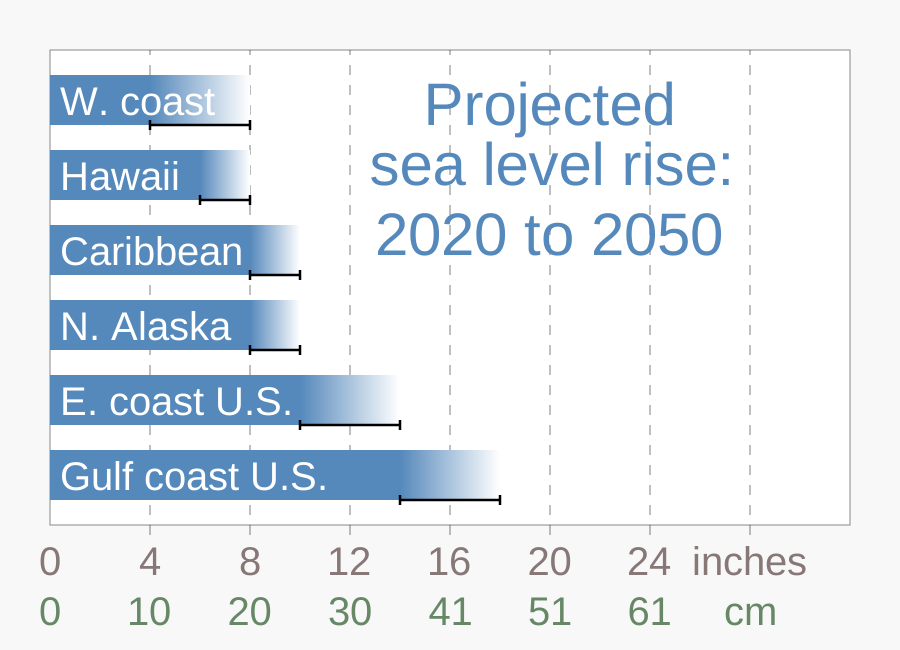
A rising tide gauge trend is real data, but it is never, by itself, a measurement of climate-driven sea level rise — it is a measurement of relative sea level, and the land-motion component sitting inside that number can be many times larger than the ocean's own contribution, as Galveston demonstrates. Getting from a raw multi-decade tide gauge record to a defensible statement about how fast the ocean itself is rising at a given coastline requires the GPS-based vertical land motion correction as a mandatory second step, not an optional refinement.
References
- Permanent Service for Mean Sea Level (PSMSL), https://psmsl.org/
- NOAA Tides & Currents, "Sea Level Trends," https://tidesandcurrents.noaa.gov/sltrends/sltrends_global.html
- "Land Subsidence Contributions to Relative Sea Level Rise at Tide Gauge Galveston Pier 21, Texas," PMC/National Library of Medicine, https://pmc.ncbi.nlm.nih.gov/articles/PMC7578811/
- "Application of the Dual-CGPS Concept to Monitoring Vertical Land Movements at Tide Gauges," ScienceDirect, https://www.sciencedirect.com/science/article/abs/pii/S1474706502000773
- Coastal Wiki, "Sea Level Rise," https://www.coastalwiki.org/wiki/Sea_level_rise
Related Articles