Oseanografi
Metocean Buoys: Why the Ocean Needs a Live Feed, Not Just a Snapshot
Every survey vessel covered elsewhere on this site does something a moored buoy structurally cannot: it moves, mapping wide areas of seabed or water column in detail. But a vessel can only be in one place at a time, and every survey it runs is a snapshot — a picture of conditions during the days or weeks the ship happened to be there. A metocean buoy trades that spatial mobility for something a ship survey can never offer: an uninterrupted, real-time presence at one fixed point, for years at a stretch.
What's Actually Sitting Inside a Metocean Buoy
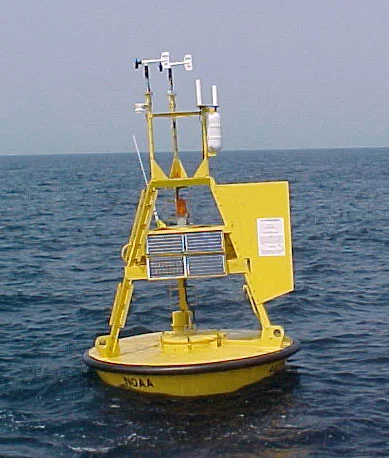
A metocean buoy carries a sensor suite built to characterise both the atmosphere and the water simultaneously: wind speed and direction, air temperature, humidity, barometric pressure, and solar radiation on the meteorological side; wave height, sea surface temperature, and current speed and direction on the oceanographic side. Many platforms carry additional instruments — CTD sensors, dissolved oxygen, pH, turbidity, and chlorophyll probes — extending their role from pure weather-and-wave monitoring into water-quality and ecological observation, all streamed back continuously rather than collected during a single visit.
Building a Network, One Station at a Time
The U.S. National Data Buoy Center traces back to the National Data Buoy Development Program, established under the Coast Guard in 1967. It moved into the newly formed NOAA in 1970 as the NOAA Data Buoy Office, and was renamed the National Data Buoy Center in 1982 under NOAA's National Weather Service. Growth was steady rather than sudden: by 1979 the network comprised 16 stations in the Pacific, 7 in the Atlantic, and 3 in the Gulf of Mexico, with eight more added in the Great Lakes shortly after. Today NDBC operates roughly 90 buoys and about 60 Coastal Marine Automated Network (C-MAN) shore stations, delivering hourly observations with real-time data typically available for the preceding 45 days.
Case in Point: DART and the Value of Real Time
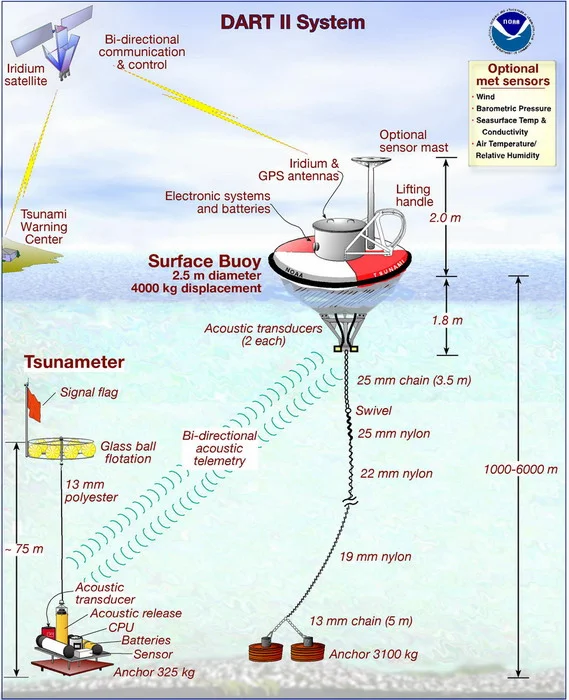
Nothing makes the case for continuous monitoring more directly than the Deep-ocean Assessment and Reporting of Tsunamis (DART) system. Each DART station pairs a seafloor Bottom Pressure Recorder (BPR), anchored at depths between 1,000 and 6,000 metres, with a companion surface buoy for communications. The BPR monitors water pressure at a resolution of roughly one millimetre of seawater using 15-second averaged samples, sensitive enough to register a tsunami wave as small as one centimetre in open-ocean sea-surface displacement — a signal no periodic survey could ever be positioned to catch. When the BPR detects an anomaly consistent with a tsunami, it relays the reading via an acoustic link to the surface buoy, which transmits it by satellite to NOAA's Tsunami Warning Centers, delivering confirmed waveform data in under three minutes.
Development of DART began in 1995, with the first six-buoy operational array completed in 2001. Deployment accelerated sharply after the 2004 Indian Ocean earthquake and tsunami exposed how much warning time a working deep-ocean detection network could buy, and by March 2008 the system had grown into a full 39-station network. None of that value comes from spatial coverage — a DART station observes exactly one point on the seafloor. Its entire value proposition is that it is always watching that one point, which is precisely the capability a ship-based survey, however detailed, structurally cannot replicate.
Two Instruments, Two Different Jobs
A hydrographic or geophysical survey vessel and a metocean buoy network answer fundamentally different questions, and neither can substitute for the other. The vessel tells you what an area of seabed or water column looks like, in detail, as of the days it was surveyed. The buoy tells you what one fixed point is doing, continuously, whether or not anyone is watching — and for hazards like tsunamis, storms, or rapidly shifting sea states, that continuous presence is the entire point.
References
- "Oceanographic Buoys for Marine Monitoring: A Review of Instrumentation, Applications, and Emerging Technologies," Journal of Marine Science and Engineering (MDPI), https://www.mdpi.com/2077-1312/14/14/1291
- NOAA National Data Buoy Center, https://www.ndbc.noaa.gov/
- NOAA National Data Buoy Center, "NDBC Real-Time Data," https://www.ndbc.noaa.gov/faq/realtime.shtml
- NOAA National Data Buoy Center, "Deep-ocean Assessment and Reporting of Tsunamis (DART)," https://www.ndbc.noaa.gov/dart/brief.shtml
- NOAA National Centers for Environmental Information, "DART Ocean Bottom Pressure Data," https://www.ncei.noaa.gov/products/natural-hazards/tsunamis-earthquakes-volcanoes/tsunamis/dart-ocean-bottom-pressure
Related Articles