Oseanografi
Wave and Current Modeling for Offshore Structure Design: What the Draupner Wave Changed
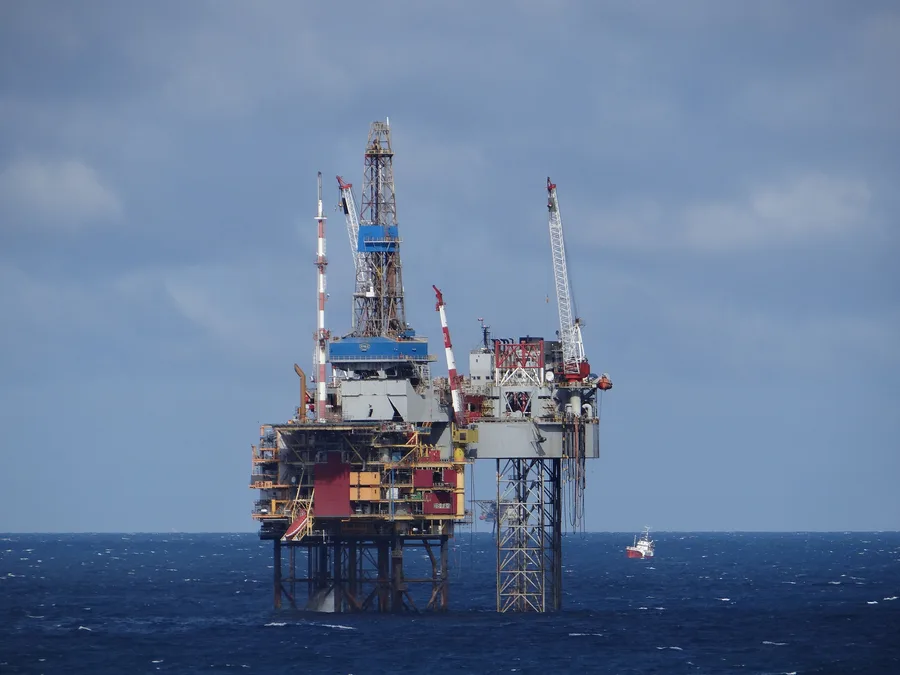
On New Year's Day 1995, a laser sensor pointed down at the sea from the Draupner gas platform in the Norwegian North Sea recorded a wave 25.6 metres high — more than twice the roughly 12-metre significant wave height of the sea state around it. The platform had been engineered to withstand a wave calculated to occur once every 10,000 years, with a predicted height of about 20 metres. The Draupner wave beat that design threshold by more than a fifth, on a day nobody expected it, and it did so while being recorded by an instrument for the first time in history rather than just described by sailors afterward.
A Single Measurement That Rewrote a Field
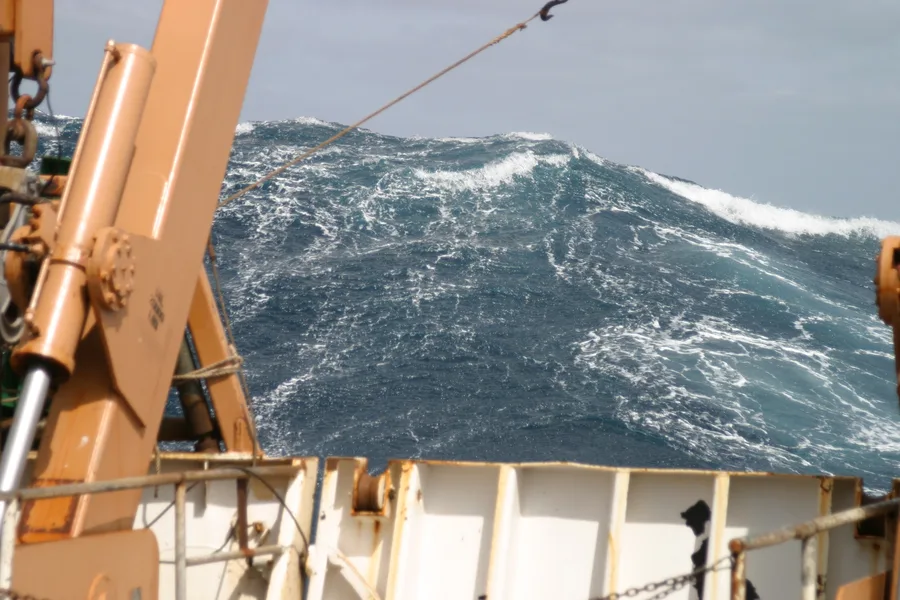
Before Draupner, "rogue waves" — waves far larger than their surroundings and inconsistent with linear wave theory — were treated by much of the engineering community as maritime folklore rather than a real design consideration. The Draupner measurement changed that almost overnight: it was the first rogue wave confirmed by direct instrumental record, its characteristics didn't fit the wave models in standard use at the time, and it caused enough minor damage to the platform to prove the reading was real. A follow-up analysis published by the platform's operator in 2000 concluded that waves like it were considerably more common than existing statistical models predicted — meaning the design assumptions used across the offshore industry up to that point had been quietly underestimating the tail of the wave-height distribution.
How Design Wave and Current Values Get Set Today
Modern offshore structure design leans on extreme value analysis rather than a single worst-case guess. Engineers identify extreme events — storms — from a hindcast of metocean conditions typically spanning more than a decade at the site, or from direct measurements where available, extracting the peak wind speed, significant wave height, and spectral period from each event. A Generalized Pareto distribution is then commonly fitted to the values that exceed a high threshold, which lets analysts extrapolate out to rare return periods — most often 50 years, the return period IEC 61400-3 specifies for limit-state and ultimate-strength design of offshore wind turbines. In hurricane-prone regions such as the U.S. Mid-Atlantic, class society guidance from ABS recommends designing to a 100-year return period instead, precisely because tropical cyclones make the tail of the distribution fatter than a standard 50-year North Sea-style climate would suggest.
Why the Hindcast Itself Has to Be Validated
An extreme value analysis is only as good as the hindcast feeding it, which is why hindcast wave models get validated against real buoy measurements before anyone trusts their output. A widely cited hindcast of the North Sea, Norwegian Sea, and Barents Sea — built on the WAM10 wave model, nested inside a coarser North Atlantic model and forced by HIRLAM10 wind fields — was checked against 40 quality-controlled buoy stations and found to reproduce the upper end of the wave-height distribution noticeably better than the older ERA-40 reanalysis, with a correlation of 0.95 against buoy data at the 99th percentile compared with 0.88 for ERA-40. That kind of validation matters because hindcast models have their own known blind spots: research comparing hindcast and buoy-derived 50-year significant wave heights along the U.S. Atlantic coast has found a systematic tendency for the hindcast to underestimate the true extreme.
Beyond Linear Theory: Modeling the Load, Not Just the Wave
Getting the design wave height right is still only half the engineering problem — the other half is translating that wave into an actual structural load, which is where linear wave theory itself starts to break down. In shallow water, where waves can break directly against a structure, engineers increasingly turn to computational fluid dynamics (CFD) to simulate breaking wave impact on monopile foundations directly, resolving the time-varying horizontal and vertical forces and overturning moments in a way that simplified wave-force formulas were never designed to capture.
Designing for the Wave You Haven't Seen Yet
The Draupner wave's real legacy isn't the specific number 25.6 metres — it's the shift in mindset it forced across the industry, from "our worst-case wave model says this won't happen" to "our statistics say something like this eventually will, so design for it." Every 50-year design wave height quoted on a modern offshore project traces back through that same chain: a validated hindcast, an extreme value fit, increasingly a joint wind-wave probability model, and now CFD to translate the number into an actual load — all downstream of a lesson the North Sea taught the industry on the first day of 1995.
References
- "Rogue Waves: Theory, Methods, and Applications — 30 Years After the Draupner Wave," Chaos: An Interdisciplinary Journal of Nonlinear Science (AIP Publishing), https://pubs.aip.org/aip/cha/article/35/6/060402/3350564/Rogue-waves-Theory-methods-and-applications-30
- ECMWF, "What Conditions Led to the Draupner Freak Wave?" https://www.ecmwf.int/en/newsletter/148/meteorology/what-conditions-led-draupner-freak-wave
- American Physical Society, "Existence of Rogue Waves," https://www.aps.org/apsnews/2018/01/existence-rogue-waves
- National Renewable Energy Laboratory (NREL), "Comparison of API and IEC Standards for Offshore Wind Turbine Design," https://docs.nrel.gov/docs/fy13osti/49688.pdf
- "Design Loads and Reliability Assessment of Marine Structures Considering Statistical Models of Metocean Data," Ocean Engineering (ScienceDirect), https://www.sciencedirect.com/science/article/abs/pii/S0029801821014232
- Reistad, M. et al., "A High-Resolution Hindcast of Wind and Waves for the North Sea, the Norwegian Sea, and the Barents Sea," Journal of Geophysical Research: Oceans, https://agupubs.onlinelibrary.wiley.com/doi/full/10.1029/2010JC006402
Related Articles
Metocean Buoys: Why the Ocean Needs a Live Feed, Not Just a Snapshot
Acoustic Doppler Current Profiler: Measuring Currents Instead of Depth